The network for creativity
Join 1.25M professional creatives like you
Connect with clients, get discovered, and run your business 100% commission-free
Creatives on Contra have earned over $150M and we are just getting started
Back to feedPost

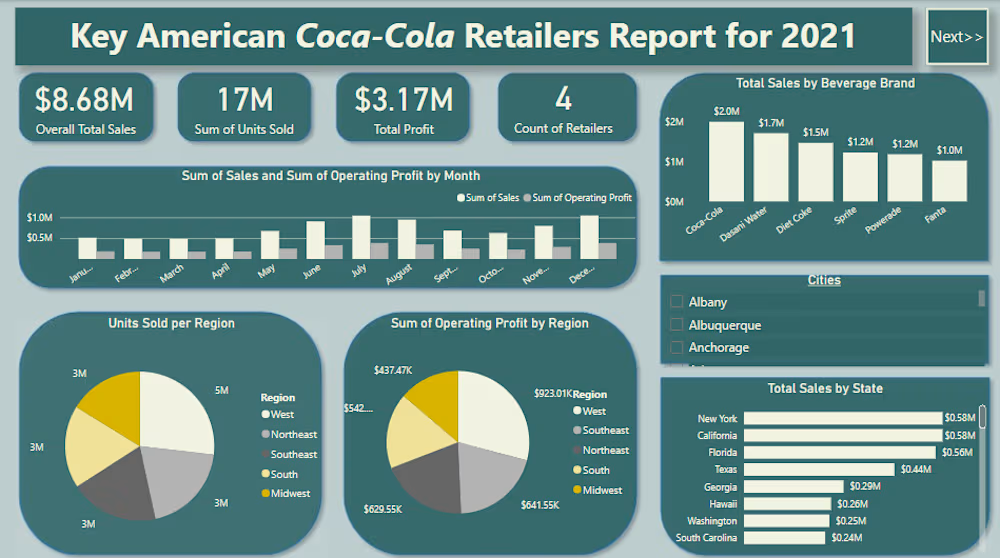
:The Cola cola sales dashboard showcases the general sales trends for coca cola products in the United States for the year 2021 Its a two page dashboard which shows insights for the sales of coca cola products for the year 2021

The network for creativity
Join 1.25M professional creatives like you
Connect with clients, get discovered, and run your business 100% commission-free
Creatives on Contra have earned over $150M and we are just getting started

Related posts

📊 Turn Your Excel Data Into a Clear Business Dashboard
Still managing your business reports in Excel and spending hours trying to understand your numbers?
I help small businesses turn their existing Excel/CSV data into simple, interactive Power BI dashboards.
With a dashboard, you can quickly track:
• 📈 Sales performance
• 🏆 Top-selling products
• 👥 Customer trends
• 🏪 Store/branch performance
• 📦 Product performance
• 🎯 KPIs and monthly targets
I recently built a retail analytics dashboard using Power BI, with data cleaning and transformation using Excel/Power Query.
I'm currently looking to work with small businesses, retailers, and growing teams that want their data to be easier to understand and use.
💬 If you already maintain your business data in Excel, feel free to message me. I'd be happy to show you what a dashboard could look like for your business.


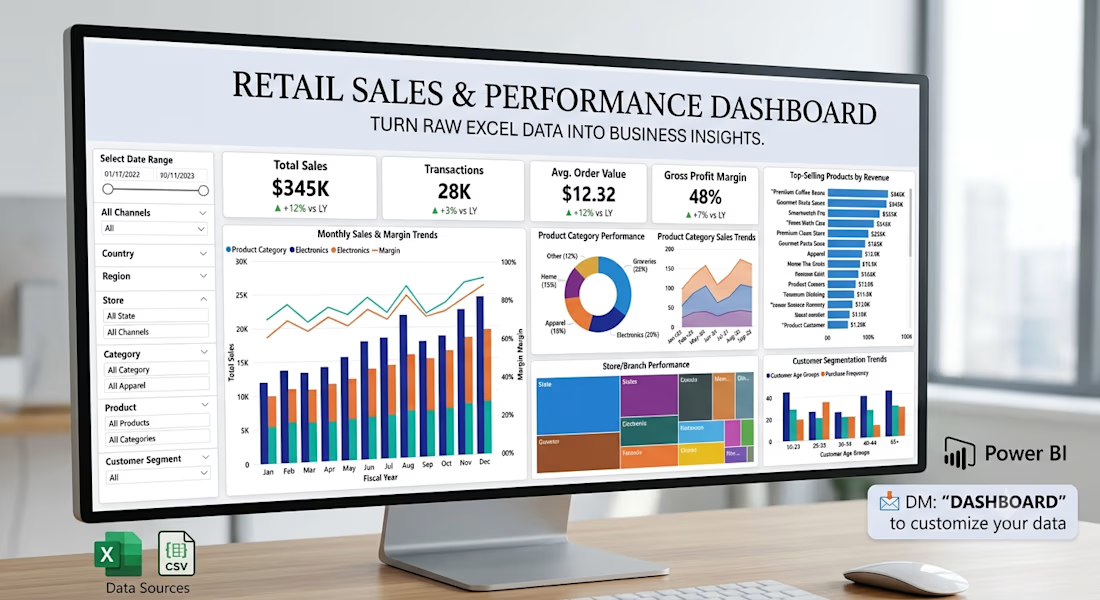

I built an interactive Power BI sales dashboard by cleaning and analyzing data, creating KPIs, tracking trends, and presenting actionable insights through interactive visualizations.

𝗕𝘂𝗶𝗹𝗱𝗶𝗻𝗴 𝗱𝗮𝘀𝗵𝗯𝗼𝗮𝗿𝗱𝘀 𝘁𝗵𝗮𝘁 𝗮𝗰𝘁𝘂𝗮𝗹𝗹𝘆 𝗮𝗻𝘀𝘄𝗲𝗿 𝗯𝘂𝘀𝗶𝗻𝗲𝘀𝘀 𝗾𝘂𝗲𝘀𝘁𝗶𝗼𝗻𝘀 📊
Most dashboards show you what happened.
𝗕𝘂𝘁 𝗜 𝘄𝗮𝗻𝘁𝗲𝗱 𝘁𝗵𝗶𝘀 𝗼𝗻𝗲 𝘁𝗼 𝗴𝗼 𝗮 𝘀𝘁𝗲𝗽 𝗳𝘂𝗿𝘁𝗵𝗲𝗿 𝘄𝗵𝘆 𝗱𝗶𝗱 𝗶𝘁 𝗵𝗮𝗽𝗽𝗲𝗻, 𝗮𝗻𝗱 𝘄𝗵𝗮𝘁 𝘀𝗵𝗼𝘂𝗹𝗱 𝘄𝗲 𝗱𝗼 𝗻𝗲𝘅𝘁?
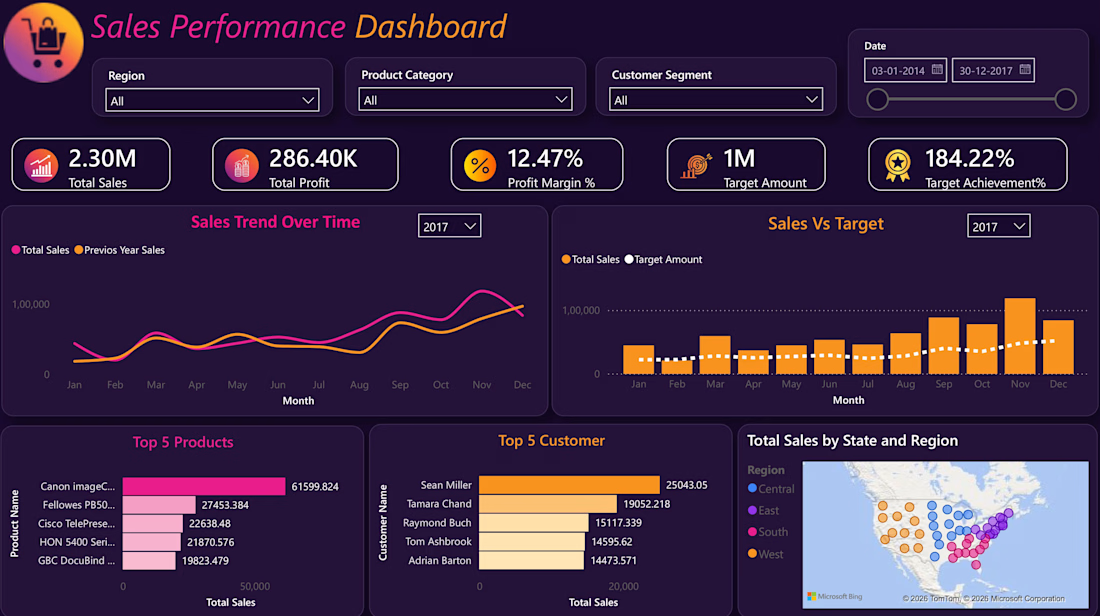
📈 Sales increased by 𝟮𝟰%
📉 Profit declined by 𝟭𝟮%
📉 Margin dropped by 𝟮𝟵%
𝗔𝗳𝘁𝗲𝗿 𝗱𝗶𝗴𝗴𝗶𝗻𝗴 𝗶𝗻𝘁𝗼 𝘁𝗵𝗲 𝗱𝗮𝘁𝗮, 𝗜 𝗮𝗱𝗱𝗲𝗱 𝗮 𝗳𝗶𝗻𝗮𝗹 𝗿𝗲𝗰𝗼𝗺𝗺𝗲𝗻𝗱𝗮𝘁𝗶𝗼𝗻𝘀 𝗽𝗮𝗴𝗲:
* Cap discounts at 𝟮𝟬%
* Review 𝗹𝗼𝘀𝘀-𝗺𝗮𝗸𝗶𝗻𝗴 𝗮𝗰𝗰𝗼𝘂𝗻𝘁𝘀
* Focus on the 𝗖𝗼𝗿𝗽𝗼𝗿𝗮𝘁𝗲 𝘀𝗲𝗴𝗺𝗲𝗻𝘁
For me, a good dashboard isn’t just about making charts look nice.
It should help someone quickly understand the problem and decide what to look at next.
🎥 𝗜 𝗮𝗹𝘀𝗼 𝗿𝗲𝗰𝗼𝗿𝗱𝗲𝗱 𝗮 𝘀𝗵𝗼𝗿𝘁 𝘄𝗮𝗹𝗸𝘁𝗵𝗿𝗼𝘂𝗴𝗵 𝗼𝗳 𝘁𝗵𝗲 𝗱𝗮𝘀𝗵𝗯𝗼𝗮𝗿𝗱:
https://lnkd.in/dcfWwznc





