The network for creativity
Join 1.25M professional creatives like you
Connect with clients, get discovered, and run your business 100% commission-free
Creatives on Contra have earned over $150M and we are just getting started
Back to feedPost

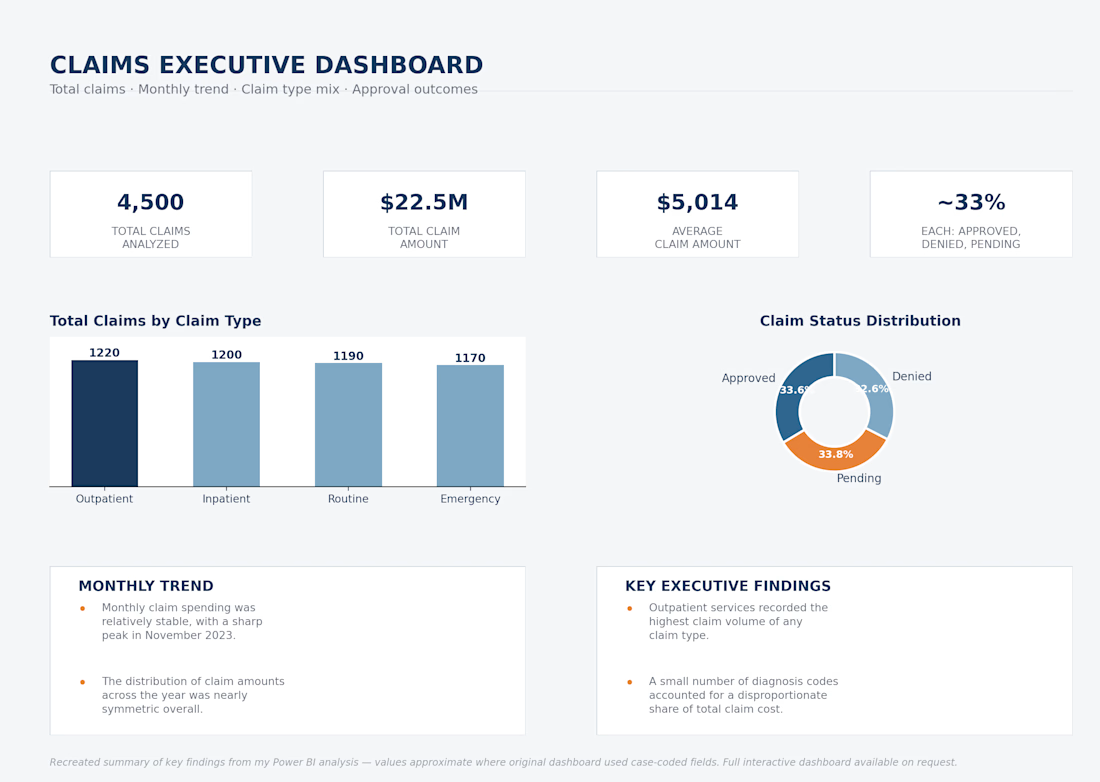
I ran statistical tests on 4,500 healthcare insurance claims worth $22.5M, half-expecting patient demographics to explain at least some of the cost variation.
They didn't. Age, income, gender, provider specialty, even claim type — none of it came back statistically significant against claim amount or status.
What actually stood out was Pediatrics. $4.9M in claims, the highest average claim amount of any specialty. Not a "who's filing the claim" problem — a specialty-specific one.
I built four Power BI dashboards (Executive, Patient Insights, Provider Performance, Claims Analysis) so this kind of pattern shows up as it happens, not just in a one-off report six months later.
If your team is still reviewing claims by demographic segment, this might be worth a second look.


The network for creativity
Join 1.25M professional creatives like you
Connect with clients, get discovered, and run your business 100% commission-free
Creatives on Contra have earned over $150M and we are just getting started




Related posts

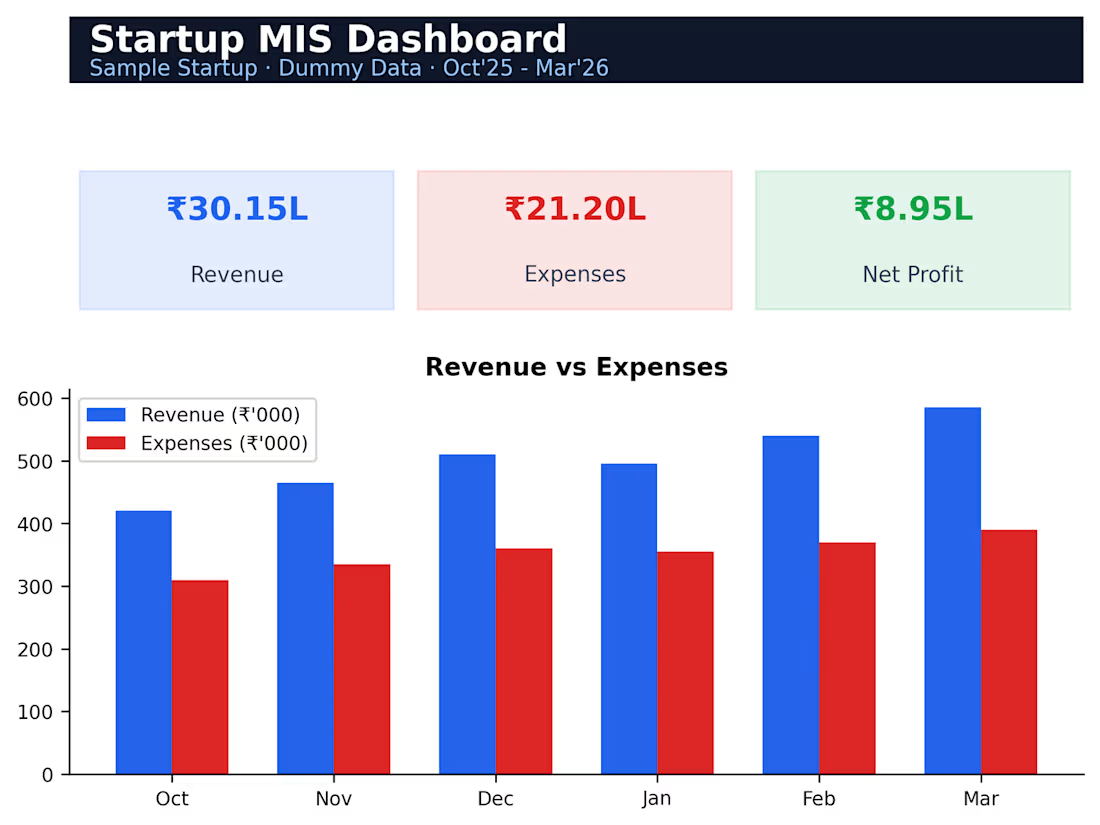
A 6-month MIS dashboard tracking revenue, expenses, net profit and margin trends with an auto-updating bar chart, giving founders a one-page view of business health.



The best testimonial section doesn’t just share kind words from the clients
It builds trust from every angle:
• Who the client is
• What changed
• Measurable results
• Proof of the work
• Answers to common objections
Turn testimonials into your strongest conversion asset


Starter Tier Project
Project name (100 characters limit)
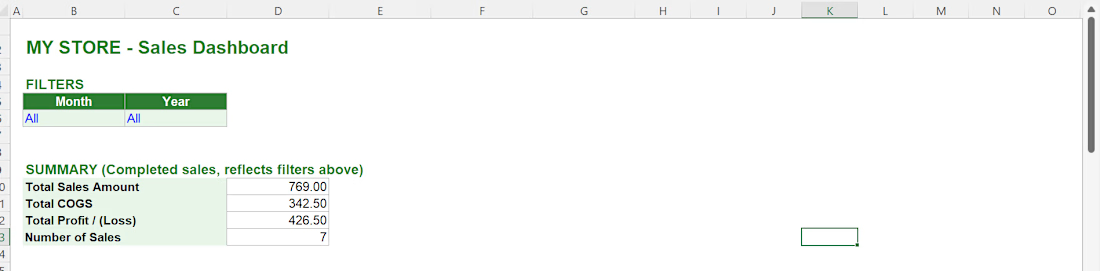
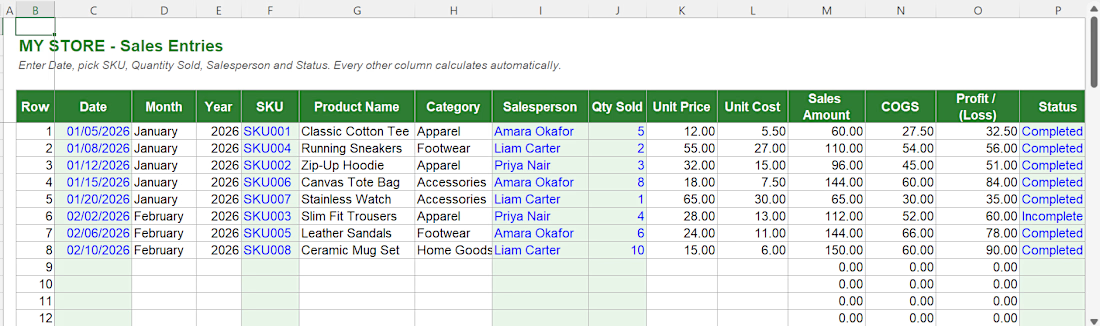
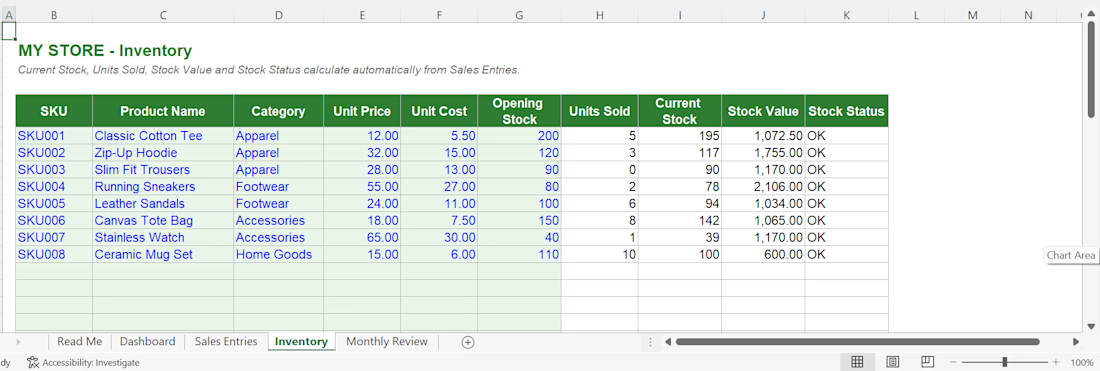
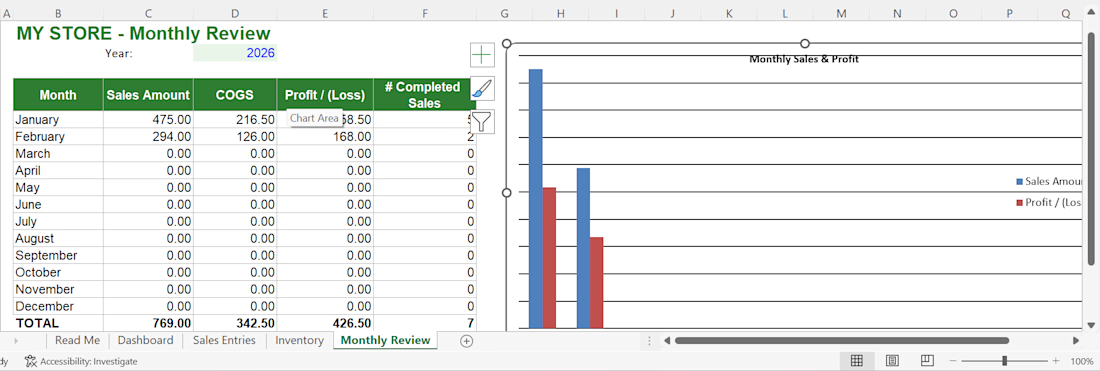
Starter E-Commerce Sales & Inventory Dashboard