The network for creativity
Join 1.25M professional creatives like you
Connect with clients, get discovered, and run your business 100% commission-free
Creatives on Contra have earned over $150M and we are just getting started
Back to feedPost
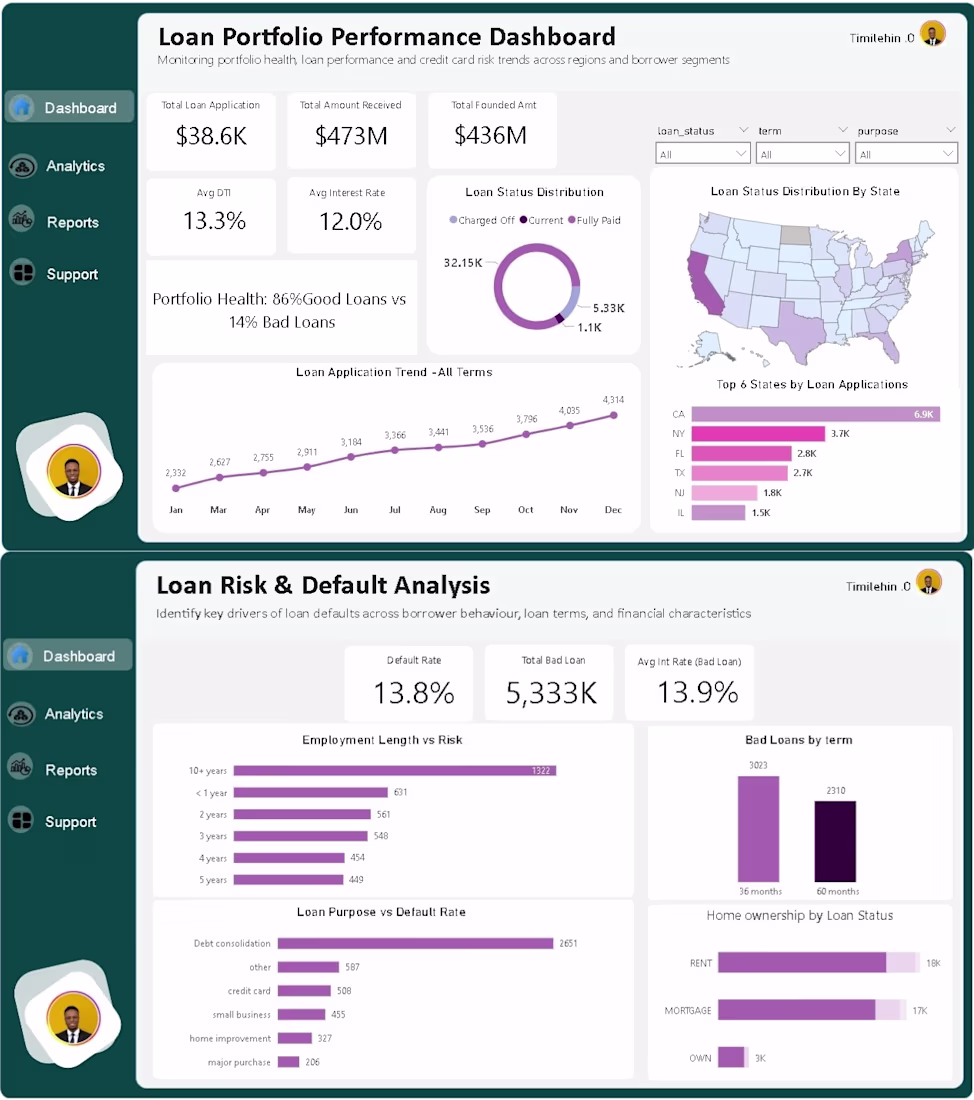
A loan portfolio can look profitable on paper… and still be quietly losing money.
That’s exactly what I noticed while working with this dataset.
Revenue was coming in.
Applications were increasing.
Performance looked “healthy.”
But something didn’t add up.
Why were defaults increasing in a system that looked like it was growing?
That question led me to build this Loan Portfolio & Risk Analysis Dashboard not to visualize data, but to uncover what’s quietly hurting performance.
Here’s what stood out after digging deeper:
1. Growth was hiding risk
Loan applications kept rising month after month.
On paper, that’s growth.
But when segmented, a portion of that growth was coming from higher-risk borrowers, not necessarily better-performing ones.
2. Portfolio health looked good… until you zoom in
At a glance:
86% good loans vs 14% bad loans.
Sounds healthy, right?
But that 14% is where the real story is
because that’s where losses live.
3. Loan terms were influencing default behavior
When I compared loan durations:
• 36-month loans performed better
• 60-month loans showed higher default concentration
Longer terms = more uncertainty = higher risk exposure.
4. Employment length revealed stability patterns
Borrowers with longer employment history showed lower default tendencies.
Short-term employment?
Higher risk.
This is the kind of insight that can improve credit scoring decisions immediately.
5. Loan purpose matters more than most people think
Not all loans behave the same.
Some categories consistently showed higher default rates, meaning:
👉 Risk isn’t just about who you lend to
👉 It’s also about why they’re borrowing
6. Geography tells a hidden story
Certain states contributed more to total applications.
But volume ≠ quality.
Some high-volume regions also showed higher bad loan concentration, which is a red flag for lenders expanding aggressively.
This project changed how I see “good dashboards.”
It’s not about fitting charts into a page.
It’s about asking:
“Where is the business losing money without realizing it?”
Because in finance, small unnoticed risks compound into big losses.
If you’re working with financial data, always go beyond totals.
Break it down. Segment it. Question it.
That’s where the real insights are.
I’m currently open to working on data analysis projects in finance, risk, and business performance.
Let’s build solutions that don’t just look good but actually drive decisions.
The network for creativity
Join 1.25M professional creatives like you
Connect with clients, get discovered, and run your business 100% commission-free
Creatives on Contra have earned over $150M and we are just getting started
Trending
Claude
Claude has entered the design space. How are you using Claude Design?
Contra University
Learn from expert creatives how to earn more using next-gen AI tools.
creativeaiflow
Creative AI workflows are evolving. What tools do you use, and what are their strengths and weaknesses?
freelancerlife
Freelancer life is wins, pivots, and everything in between. What’s yours right now?
Related posts
Competitive & Category Research
Before designing anything, we map the category.
Who else is in the space. What they look like. What they sound like. Where the gaps are. This isn't about copying, it's about understanding what "default" looks like in an industry, so we know exactly what to avoid and where there's room to stand out.
Research is 20% of the timeline and 80% of why the final direction feels inevitable instead of arbitrary.


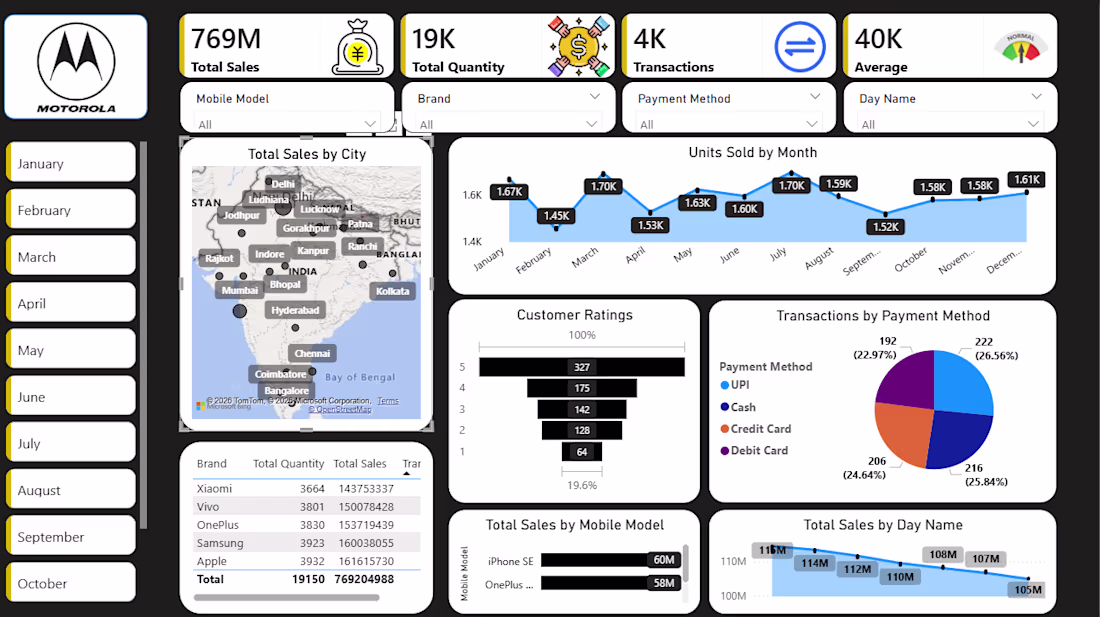
Project Overview
This Mobile Sales Analytics Dashboard provides a detailed overview of smartphone sales performance, customer satisfaction ratings, and purchasing trends across major Indian cities and top mobile brands. Built for retail and market analytics, it translates sales and inventory metrics into visual insights to optimize regional supply chains and product positioning.