The network for creativity
Join 1.25M professional creatives like you
Connect with clients, get discovered, and run your business 100% commission-free
Creatives on Contra have earned over $150M and we are just getting started
Back to feedPost

One thing I’ve learned from working with data, spreadsheets, dashboards, and systems:
Most analytics problems are not tool problems. They are clarity problems.
When data ownership is unclear, metrics conflict, and workflows are fragmented, even the best dashboards fail. But when data is clean, structured, and aligned to decisions, simple Excel models often outperform complex BI stacks.
In your experience, what made the biggest difference in real projects — better tools, or better structure and ownership ?
The network for creativity
Join 1.25M professional creatives like you
Connect with clients, get discovered, and run your business 100% commission-free
Creatives on Contra have earned over $150M and we are just getting started











Related posts

Working on a SaaS dashboard concept in Figma. 🚀
The goal is to make complex business data easier to scan and understand through clear visual hierarchy, structured analytics cards, and organized navigation.
Still refining the details and exploring ways to make the experience more intuitive.
What matters more to you in a dashboard: clean visuals or faster access to insightful?
#Ui designs #Ux design #Saas design #Figma
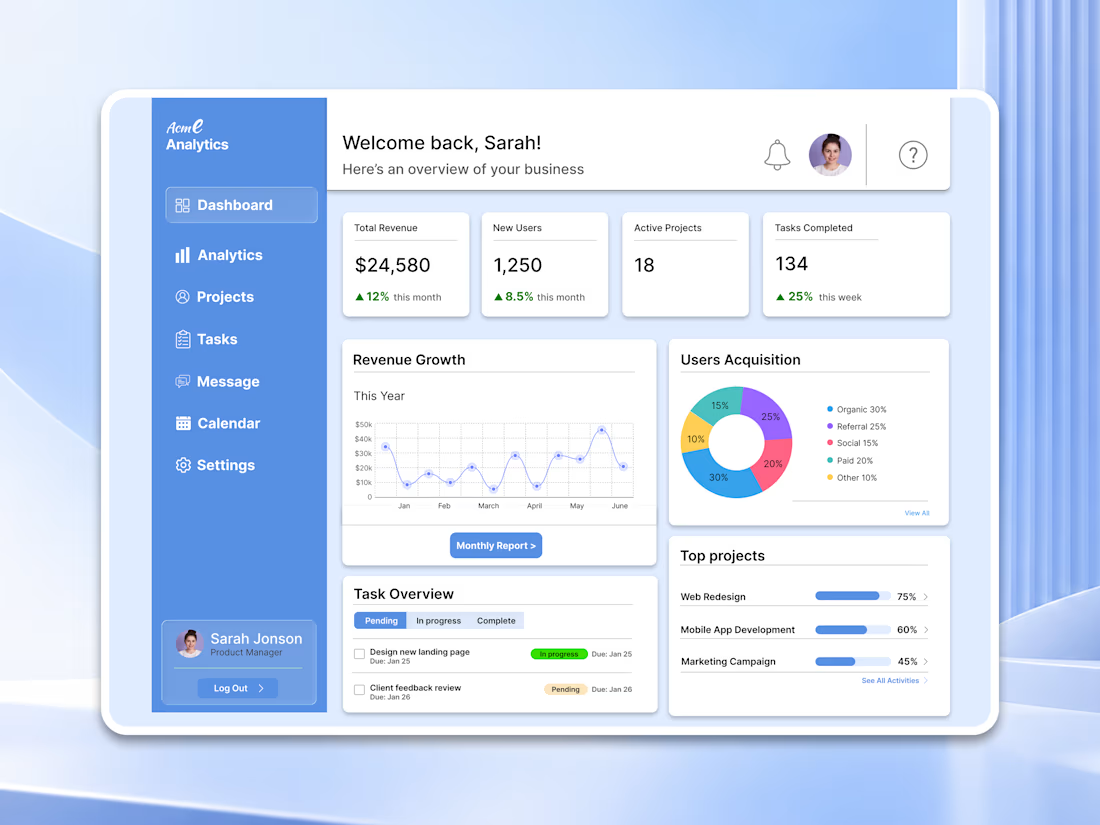

For a dashboard like this, I’d test whether the key action stays visible when the cards are filled with real, uneven data—not just placeholder numbers. What kind of business data are you designing the first view around?

Project Management Dashboard – A powerful and intuitive interface designed to enhance team collaboration, productivity, and workflow efficiency.


VeloHub – Logistics & Warehouse Management Dashboard
A streamlined warehouse management dashboard built to simplify logistics, monitor fleet performance, and keep operations running smoothly.
Want to create something like this?
Let's Talk!
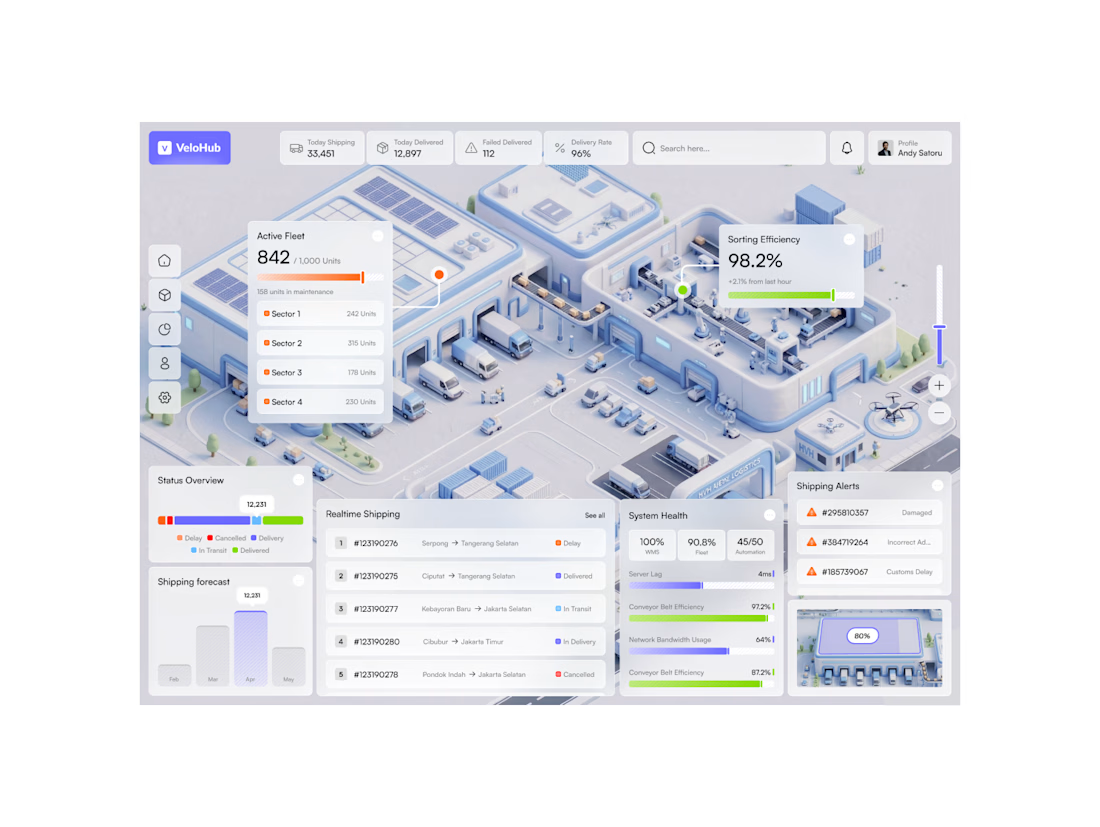

That isometric 3D warehouse view is what makes this one special, Hatypo. A spatial view of the whole facility with live stats like picking accuracy at 98.2% tells an ops manager more in one glance than a wall of tables ever could.

