The network for creativity
Join 1.25M professional creatives like you
Connect with clients, get discovered, and run your business 100% commission-free
Creatives on Contra have earned over $150M and we are just getting started
Back to feedPost

Retail Fraud Analysis
Retail businesses face a tough balancing act: missing real fraud drains revenue, while excessive security flags can disrupt legitimate customers.
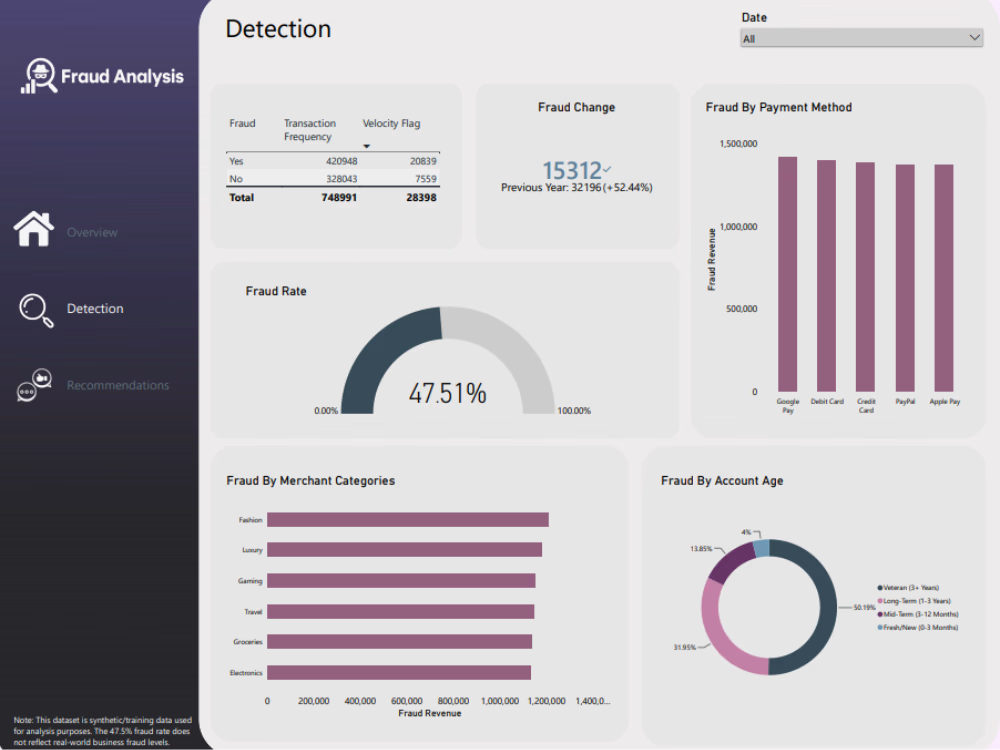
I built an end-to-end fraud analytics project using 100,000 retail transactions to uncover fraud patterns and risk exposure across payment methods, merchant categories, account age, transaction behavior, and locations.
The Data Challenge & Solution
Data profiling revealed that the native fraud-risk score was broken, flatlined at 0.0 across all records, while two location-related fields contained duplicate information. Instead of fabricating a risk score, I engineered a transparent Risk Level classification (Low, Medium, High) using behavioral security indicators including velocity, proxy/VPN usage, and high-risk devices.
Technical Execution
SQL: Cleaned data, removed duplicates, standardized formatting, and handled null values.
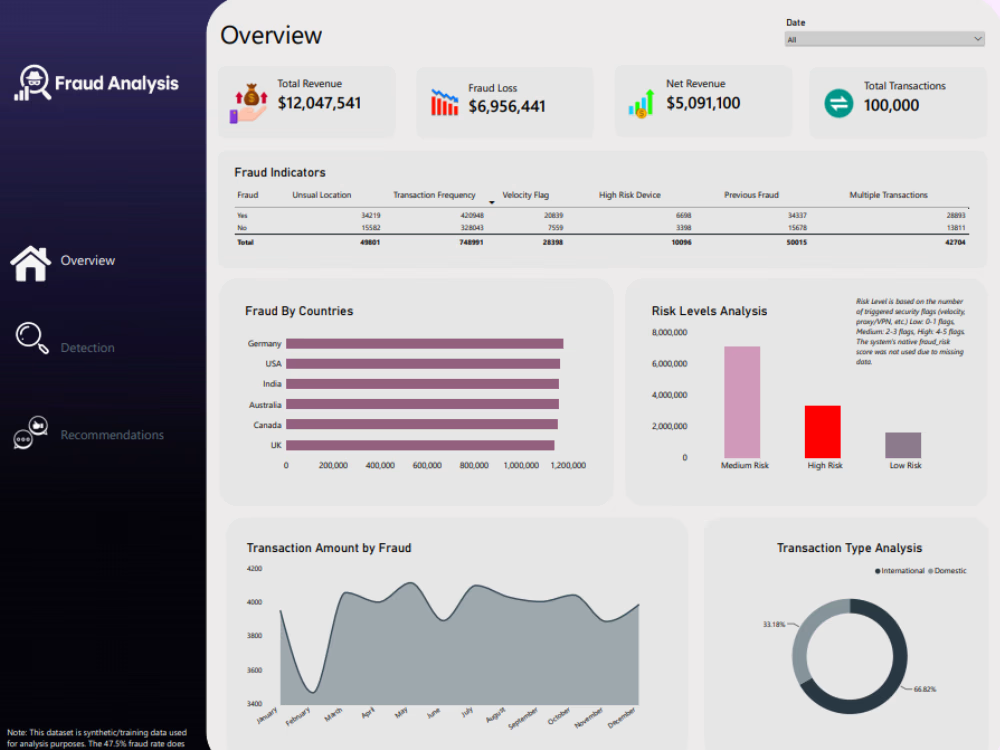
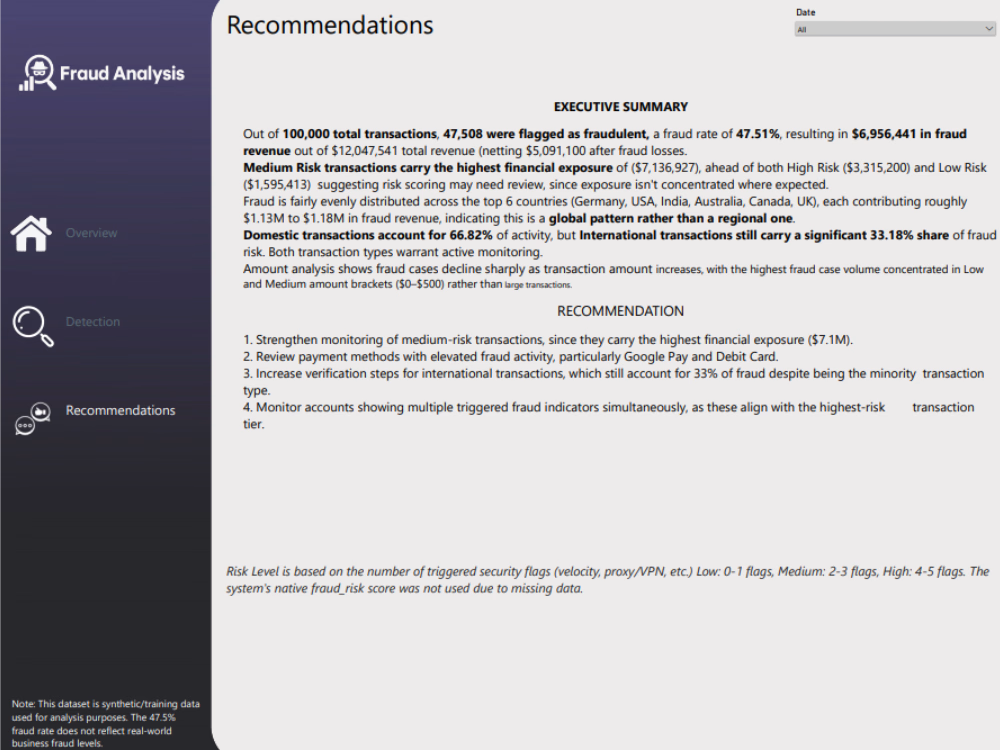
Power BI: Built an interactive 3-page dashboard: Overview, Detection, and Recommendations.
Key Findings
Medium Risk transactions carried the highest financial exposure at approximately $7.1M, followed by High Risk at $3.3M.
Fraud was concentrated in lower transaction-value brackets ($0–$500).
Domestic transactions accounted for 66.8% of activity, versus 33.2% international.
Analysis covered payment methods, merchant categories, account age, transaction frequency, velocity indicators, and countries.


The network for creativity
Join 1.25M professional creatives like you
Connect with clients, get discovered, and run your business 100% commission-free
Creatives on Contra have earned over $150M and we are just getting started











Related posts

What are your thoughts on the ongoing Power BI conversation?
In the meantime, lets have a look at this Marketing Analytics Dashboard.


Imagining you book your flight while experiencing
Meet Contrail.
Complex data into beautiful visuals in 3d.
Demo: https://flights-gr8r.vercel.app


Booking a flight with a 3D plane in the search is a fun idea. The dark UI makes the model stand out well.

I have successfully designed and deployed an end-to-end automation system for an online store infrastructure, focusing on operational efficiency and scalable data pipeline management.
By engineering a seamless integration between Shopify, MongoDB, and Replit, this system automates critical user flows and synchronizes transactional data in real time. Moving away from manual operations allows the business to focus strictly on revenue-generating workflows rather than administrative overhead.
Key Frameworks & Tools:
Backend & Hosting: Replit
Database Management: MongoDB
E-Commerce Infrastructure: Shopify
Next step is monitoring performance metrics to ensure maximum uptime and data integrity as volume scales.
#SoftwareEngineering #Ecommerce #SystemAutomation #WebDevelopment #MongoDB #Shopify



Good call making monitoring the next step instead of more features. I would track one business metric next to uptime, like manual hours saved per week, so the owner sees the value too.