The network for creativity
Join 1.25M professional creatives like you
Connect with clients, get discovered, and run your business 100% commission-free
Creatives on Contra have earned over $150M and we are just getting started
Back to feedPost

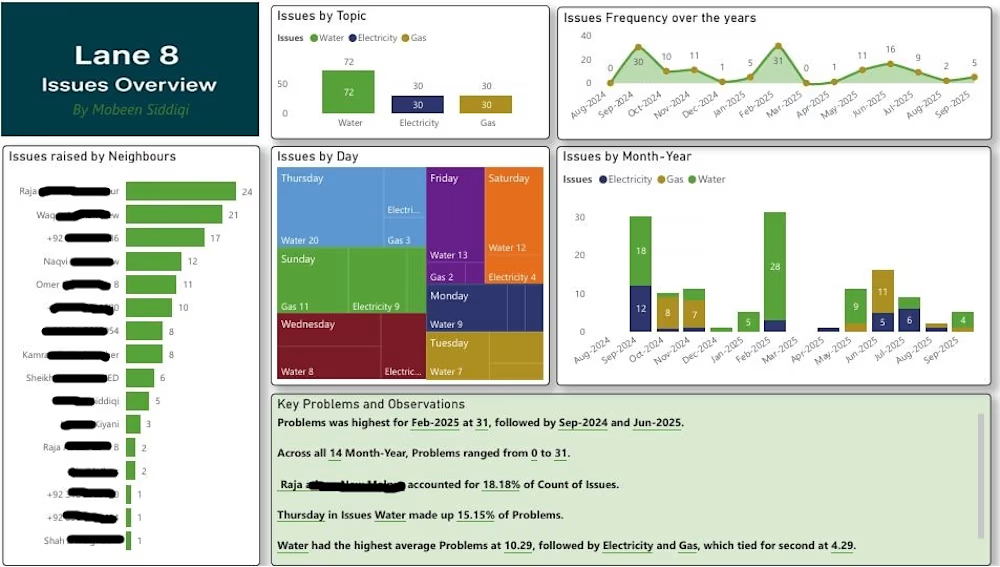
This dashboard is based on data from a WhatsApp group of a community. It is a housing complex divided into lanes. Each lane has a separate WhatsApp group, and NLP was performed on discussions. Issues related to 3 utilities were considered in reports, i.e., water, electricity, and gas. The community wanted to see the frequency of issues and who is more active to highlight the issues.


The network for creativity
Join 1.25M professional creatives like you
Connect with clients, get discovered, and run your business 100% commission-free
Creatives on Contra have earned over $150M and we are just getting started





