The network for creativity
Join 1.25M professional creatives like you
Connect with clients, get discovered, and run your business 100% commission-free
Creatives on Contra have earned over $150M and we are just getting started
Back to feedPost

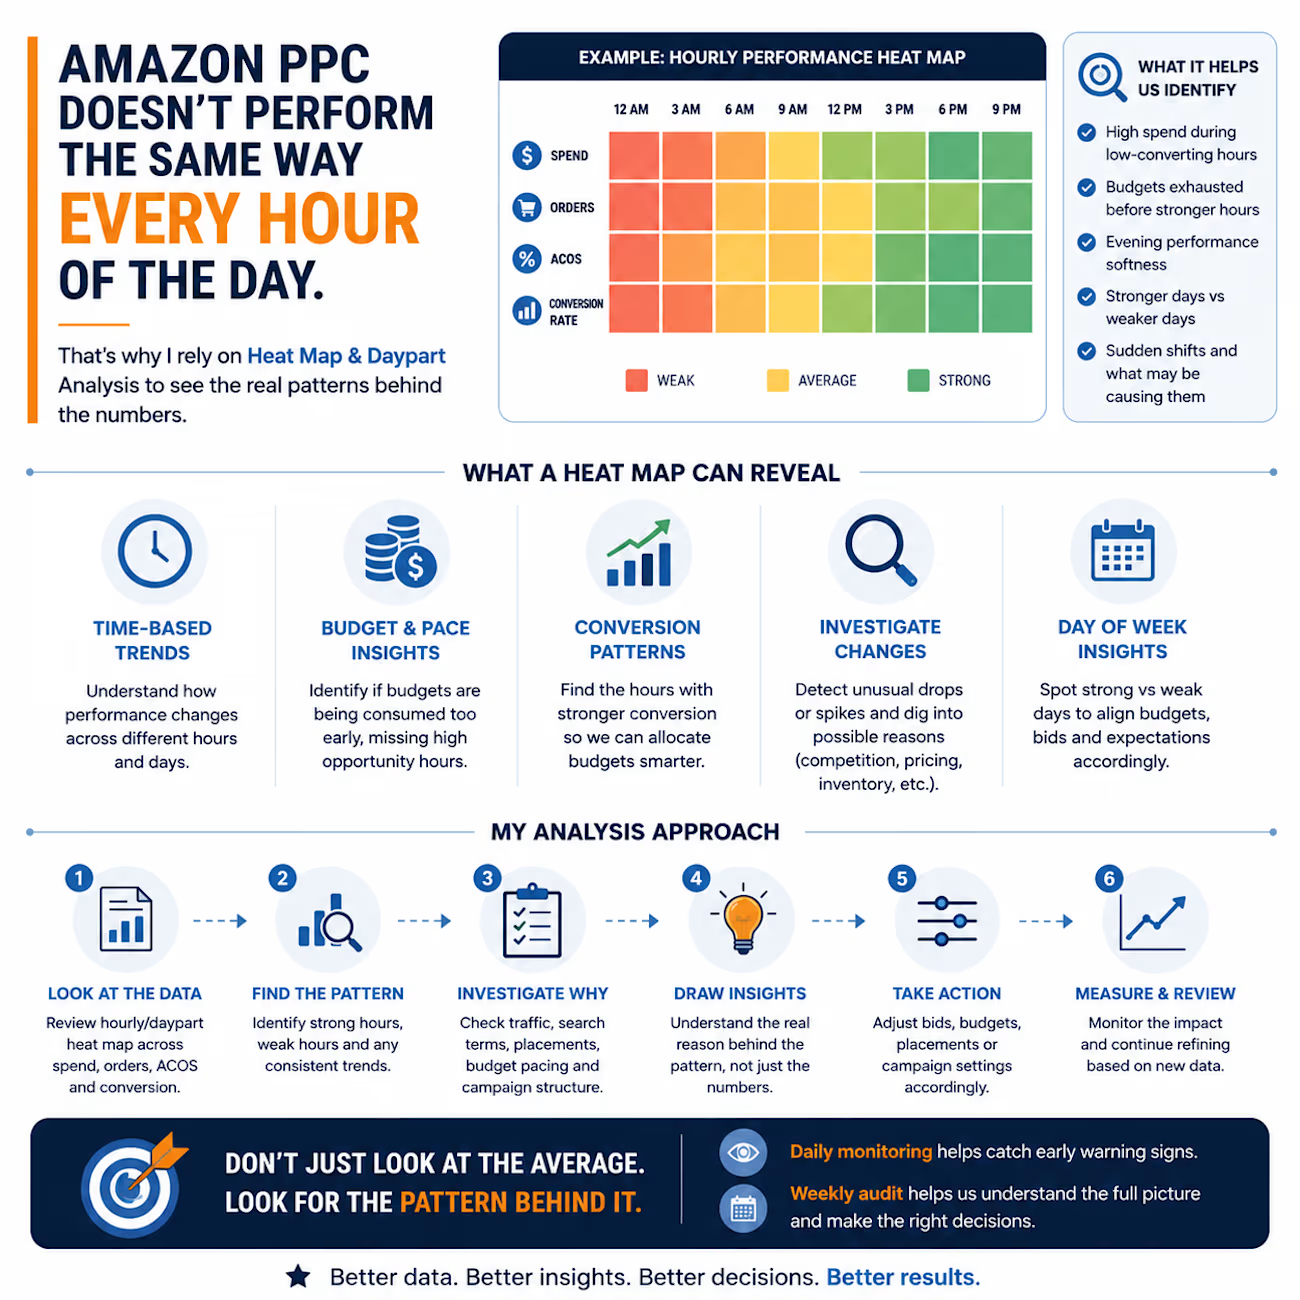
Amazon PPC doesn't perform the same way every hour of the day.
That's why I like using heat map and daypart analysis when auditing an account.
A campaign can look fine when you look at the overall numbers, but the hourly data can tell a different story.
For example:
→ Are we spending heavily during low-converting hours?
→ Are budgets being exhausted before the strongest hours?
→ Is there a pattern of weaker evening performance?
→ Are certain days consistently stronger than others?
→ Did something change in the account that explains a sudden performance shift?
The important part is not just finding a “good” or “bad” hour.
It's understanding why the pattern exists before making a change.
I don't want to increase or decrease bids simply because one part of the day looks weaker.
I'd rather investigate the traffic, conversion, spend, budget pacing and campaign structure first.
Don't just look at the average. Look for the pattern behind it.
That's where heat map analysis becomes useful.
#Amazon #AmazonPPC #AmazonFBA #Ecommerce #AmazonSeller

The network for creativity
Join 1.25M professional creatives like you
Connect with clients, get discovered, and run your business 100% commission-free
Creatives on Contra have earned over $150M and we are just getting started





Related posts

Qualifying and handling incoming sales leads manually takes hours of tedious, repetitive work. Every time a potential client submits an inquiry, you have to manually read their budget, assign priority, post updates to team channels, log details into spreadsheets row by row, and draft custom proposal emails from scratch.


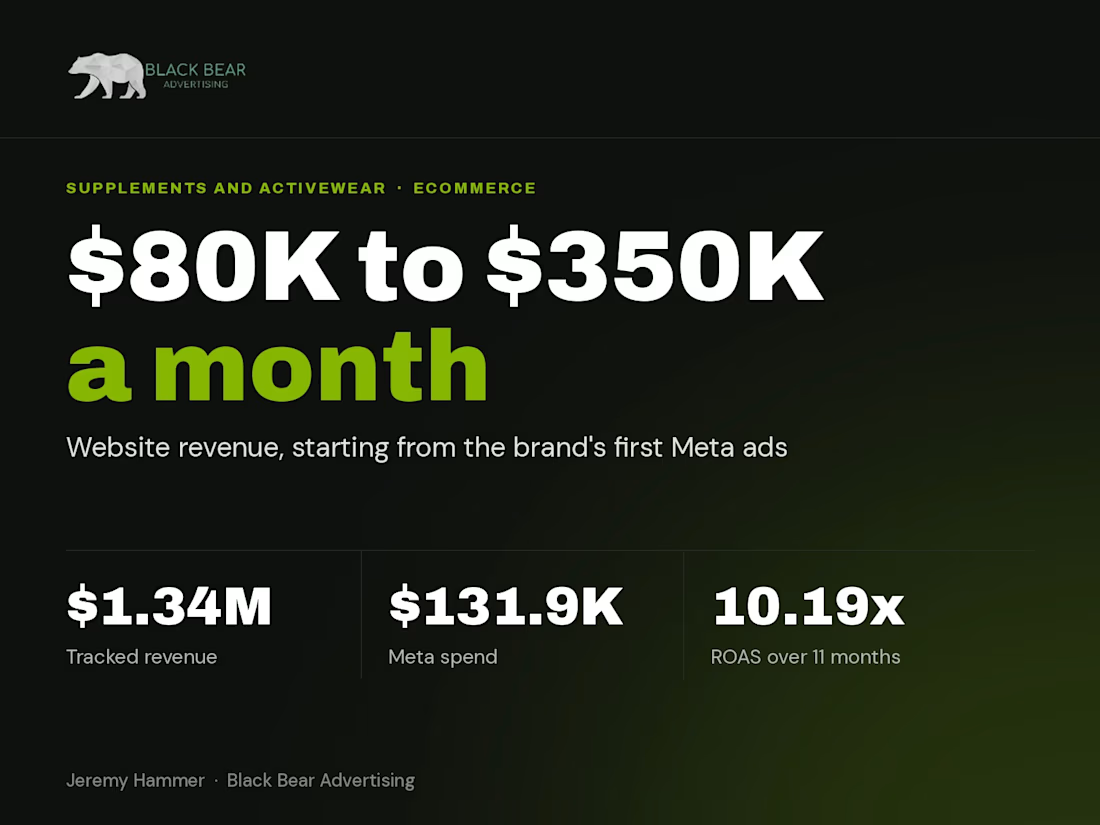
A supplements and activewear brand was making about $80K a month on its website and had never run Facebook ads. I built the acquisition system behind the results, including the customer research, ad creative and copy, landing pages, and first-party tracking. I read their reviews and comments until I knew why people bought, then wrote the ads in their customers' own words. Over 11 months that turned into 35 Meta campaigns. Monthly website revenue went from about $80K to $350K by month eight, and $131,900 in Meta spend returned $1.34M in tracked revenue, a 10.19x ROAS.



Interactive Global Ads Performance dashboard analyzing full-year 2024 paid media data across Google, Meta & TikTok for a marketing agency. Consolidates spend, revenue, conversions & efficiency metrics (ROAS, CPA, CTR, CPC) into one view so stakeholders can track KPIs, spot seasonality, compare platforms, and find top industries & countries. Features dynamic filters, MoM KPI trends, funnel analysis, and conditional-formatted tables. Delivered actionable insights on budget reallocation and campaign efficiency, turning raw multi-platform data into a clear decision-making tool.
