The network for creativity
Join 1.25M professional creatives like you
Connect with clients, get discovered, and run your business 100% commission-free
Creatives on Contra have earned over $150M and we are just getting started
Back to feedPost

MedCore Clinical Services — 3 Sheet Merge, Billing Automation & Department Dashboard
A US medical clinic came to me with patient
visits, doctor records and billing data sitting
in 3 completely separate sheets with no
connection between them.
Duplicate visit records throughout. Department
names written inconsistently across every row.
Dates in 3 different formats. Missing patient
balances on multiple records. Payment status
incomplete across the billing sheet.
I cleaned all 3 sheets independently, merged
everything into one master clinical table and
calculated all missing patient balances
automatically.
Built a pivot view showing revenue breakdown
by department per visit type. Delivered an
input sheet with dropdown validation for
Department, Visit Type, Insurance Type and
Payment Status so new patient data is always
entered correctly.
Final summary dashboard shows total revenue,
total outstanding balance, busiest department,
most common diagnosis, total visits and paid
versus pending breakdown — two charts included,
all updating automatically with one refresh.

The network for creativity
Join 1.25M professional creatives like you
Connect with clients, get discovered, and run your business 100% commission-free
Creatives on Contra have earned over $150M and we are just getting started





Related posts

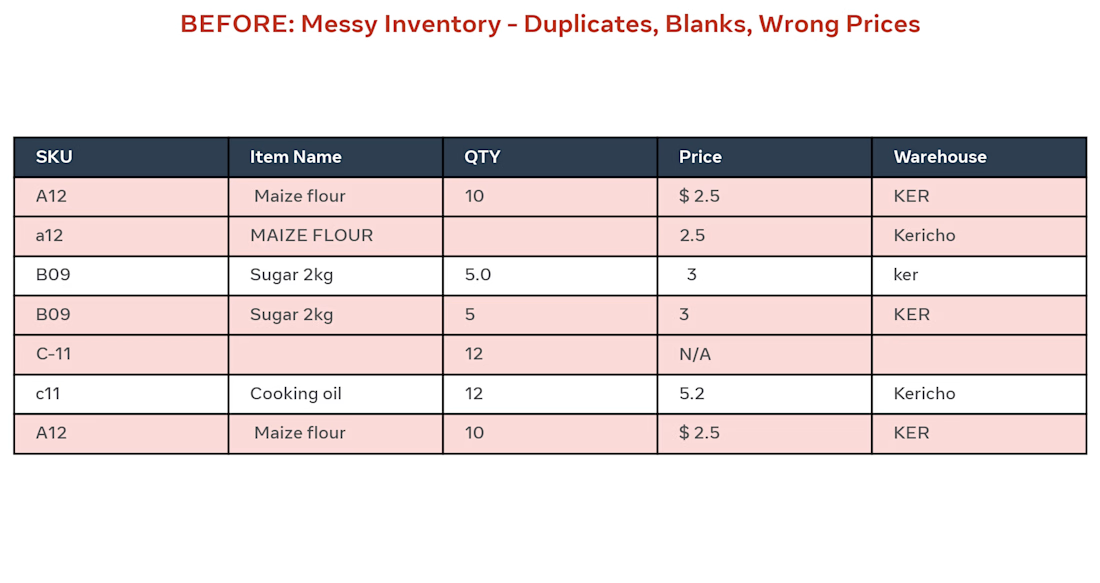
BEFORE: Client had messy Excel inventory with 500 rows, duplicates (A12 / a12), blanks, wrong prices like "$ 2.5" and "N/A", and different warehouse names (KER / ker / Kericho).
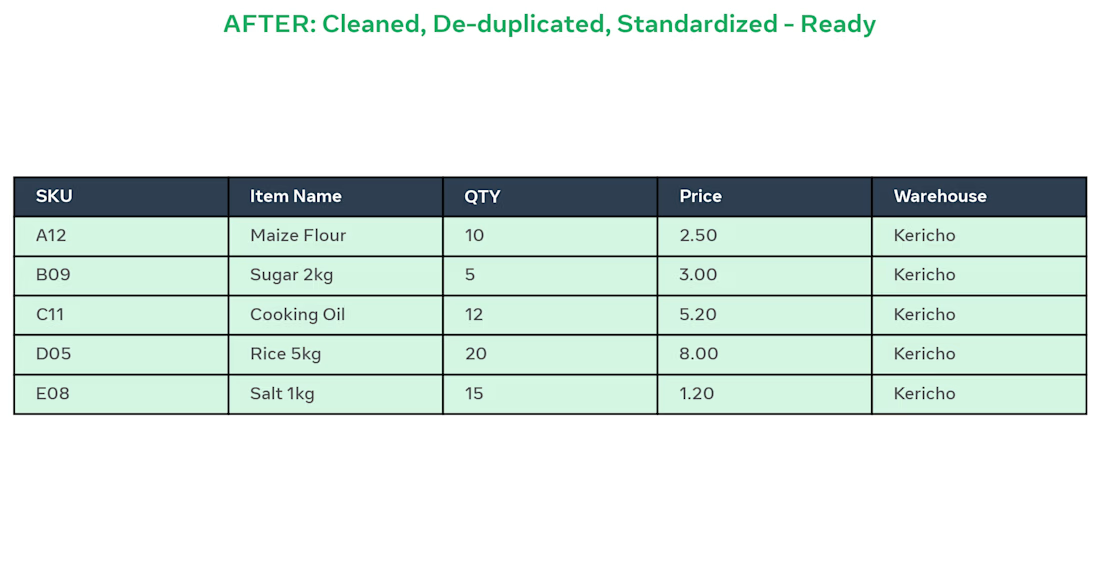
AFTER: I did:
Removed 12 duplicate SKUs
Standardized item names to Title Case
Fixed QTY and Prices to 2 decimals
Unified Warehouse to Kericho
Made sheet ready for pivot dashboard
Result: Clean, ready-to-use inventory in 2 days using Excel.
Tools: Excel, Remove Duplicates, Text to Columns, TRIM, PROPER

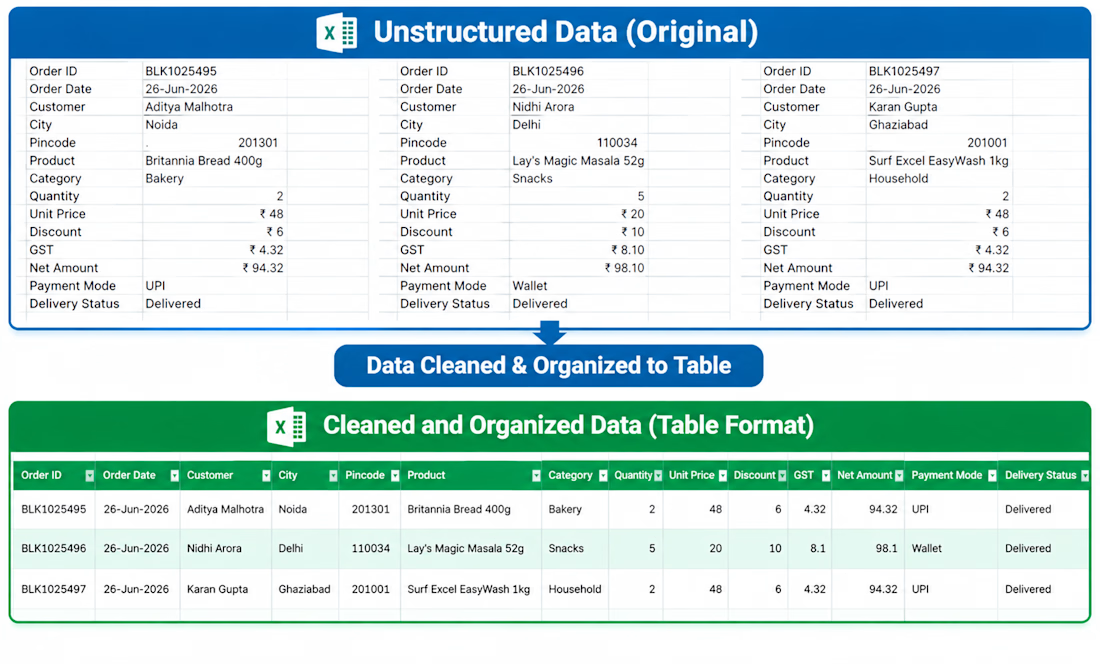
Cleaned and formatted a raw dataset in Excel by removing duplicates, fixing formatting issues, handling missing values, and organizing the data into a structured format for analysis.

I designed and engineered this interactive astronomical almanac for Ephemeris.
Blending nineteenth century celestial cartography with responsive data visualization required coordinating intricate astronomical calculations with period print typography. Programming a rotatable calendar dial that recalculates the night sky in real time, projecting accurate planetary alignments and lunar phases alongside a cataloged archive spanning 174 historical editions, turned complex ephemeris tables into an engaging visual experience.😊 👍


