The network for creativity
Join 1.25M professional creatives like you
Connect with clients, get discovered, and run your business 100% commission-free
Creatives on Contra have earned over $150M and we are just getting started
Back to feedPost

Turning Business Data Into Decision Intelligence
Most organizations have data. The challenge is turning that data into information management can actually use.
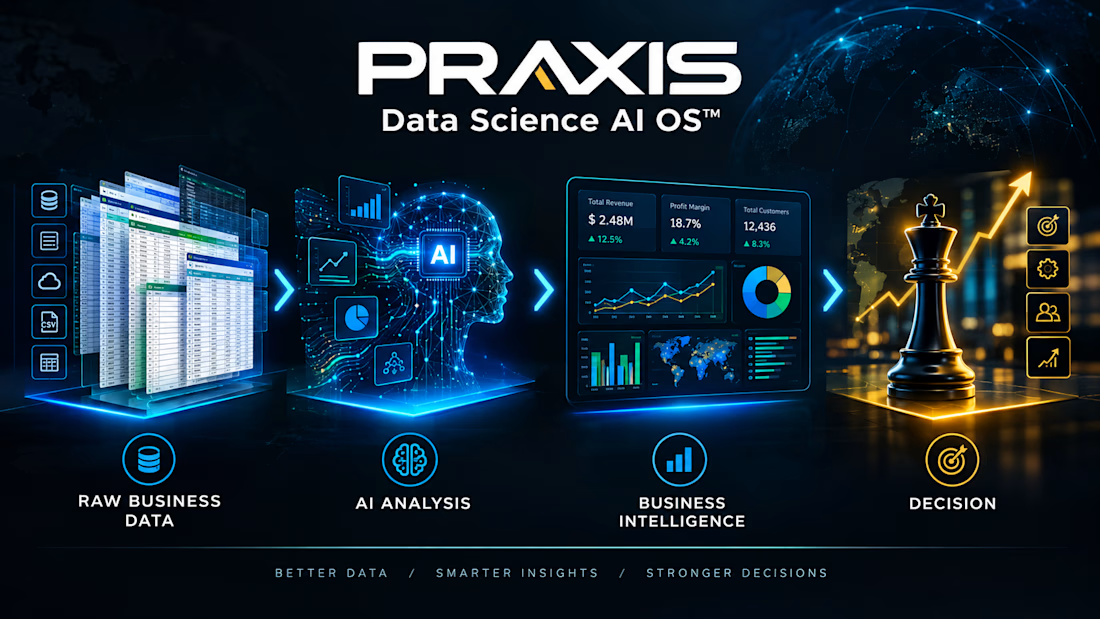
I developed the PRAXIS Data Science AI Operating System™ as a structured framework for transforming business data into actionable intelligence through AI-assisted analysis and human review.
The Challenge
Businesses often have valuable information trapped inside spreadsheets, accounting systems, inventory records and operational reports.
The problem isn't simply collecting more data.
The problem is discovering:
What is happening?
Why is it happening?
What patterns are emerging?
Where are the anomalies?
What should management do next?
The PRAXIS Approach
The system follows a structured intelligence pipeline:
Data → Data Audit → Context → AI-Assisted Analysis → Human Validation → Business Intelligence → Management Decision
I developed synthetic demonstration datasets covering Retail, Mining and Banking environments to demonstrate how the framework can operate without exposing confidential client information.
What the System Produces
Data-quality assessment
KPI analysis
Trend identification
Anomaly detection
Operational insights
Financial insights
Management reports
Decision-support recommendations
Business Value
The objective is not simply to produce charts or AI-generated commentary.
The objective is to help organizations move from:
Data → Information → Intelligence → Decision → Action
This project demonstrates my approach to combining business knowledge, data analysis, AI and human judgment into practical intelligence systems.

The network for creativity
Join 1.25M professional creatives like you
Connect with clients, get discovered, and run your business 100% commission-free
Creatives on Contra have earned over $150M and we are just getting started
Related posts


Just in time for Halloween! 🎃🔮 Excited to share this mystical tarot reading app concept, inspired by a little spooky season magic. Would love to hear your thoughts! ✨


Excellent work!

✨ Your next signature scent. 🌸
Meet Bella Vita DATE WOMAN — a fragrance-inspired experience brought to life with cinematic visuals, elegant details, and AI-powered UGC creativity.
Luxury aesthetics. Beautiful storytelling. Scroll-stopping visuals.


Business data often lives across payment, analytics, CRM, advertising, and inventory platforms. Metrik brings those signals together in one dashboard built for startups and small businesses.
See revenue, orders, customers, and business health at a glance. Compare advertising spend and ROAS across channels, explore visual KPI cards, and use smart alerts to spot unusual changes and potential risks.
The interface pairs a clean layout and rounded components with soft gradients, colorful analytics, and clear visual hierarchy, helping make business performance easier to follow.