The network for creativity
Join 1.25M professional creatives like you
Connect with clients, get discovered, and run your business 100% commission-free
Creatives on Contra have earned over $150M and we are just getting started
Back to feedPost
Project Title
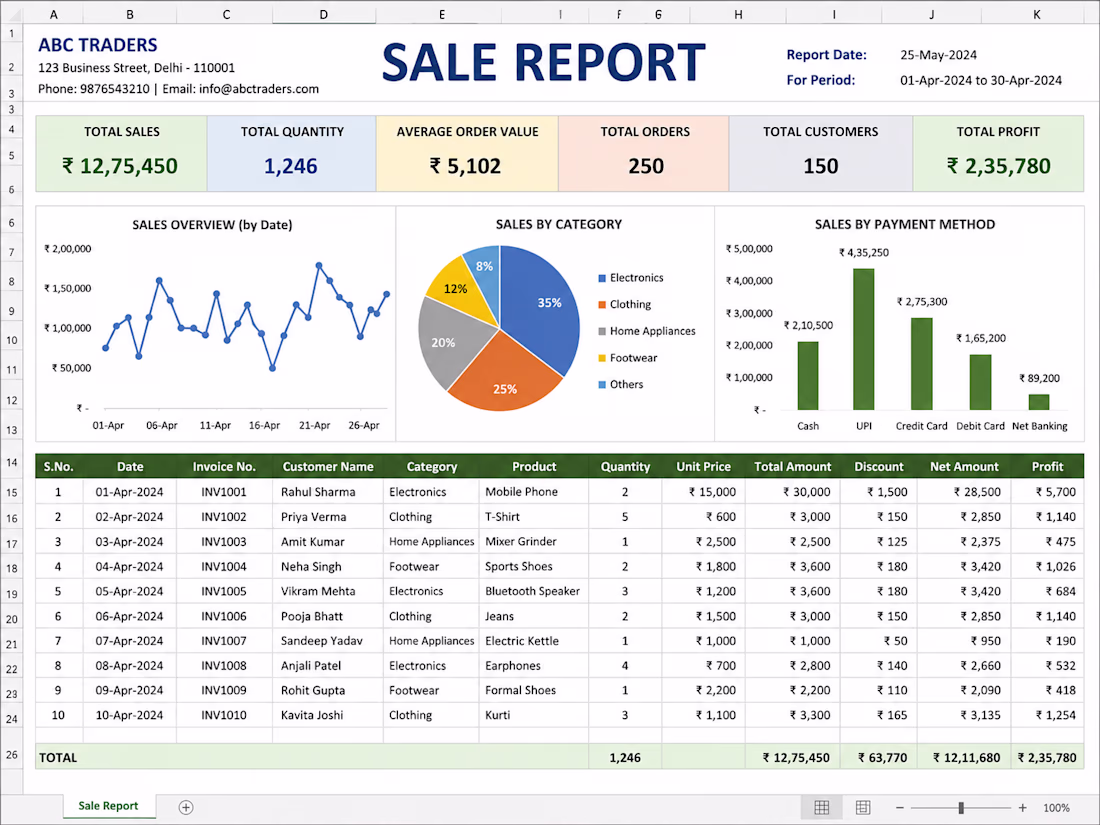
Excel Sales Report Dashboard & Data Analysis
Description
Created a professional Excel Sales Report Dashboard to track business performance and sales activities. The dashboard includes:
Total Sales, Profit, Orders, and Customer Summary
Sales Trend Analysis using Line Charts
Category-wise Sales Distribution using Pie Charts
Payment Method Analysis using Bar Charts
Automated KPI Metrics and Performance Tracking
Well-structured Sales Transaction Table
Clean and Professional Dashboard Design
Advanced Excel Formatting and Data Visualization
Tools Used: Microsoft Excel, Charts, Pivot Tables, Conditional Formatting, Data Analysis
Skills: Data Entry, Excel Dashboard, Data Visualization, Reporting, Business Analysis, Spreadsheet Management
Short Version
Designed an Excel Sales Dashboard featuring sales analytics, KPI tracking, charts, and detailed transaction reports for business performance monitoring.
The network for creativity
Join 1.25M professional creatives like you
Connect with clients, get discovered, and run your business 100% commission-free
Creatives on Contra have earned over $150M and we are just getting started
Related posts
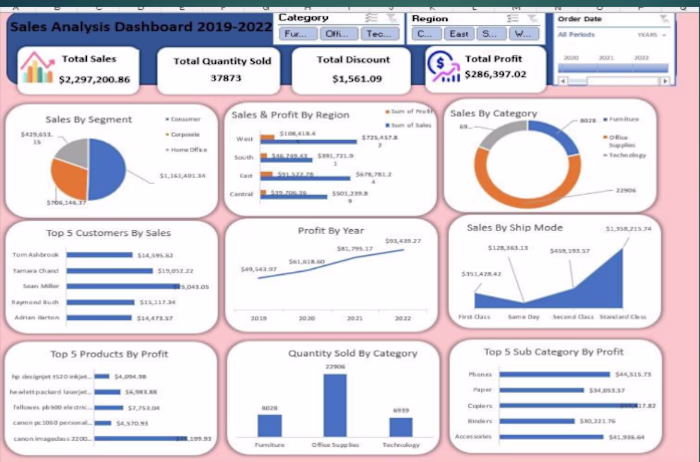
Excel Dashboard — Sales Analysis & Profit Tracking
Business Problem: A business owner needed a self-updating sales report to replace hours of manual monthly reporting.
Tools Used: Microsoft Excel, Pivot Tables, Data Visualization
KPIs Tracked: Total Sales ($2.29M), Total Profit ($286K), Units Sold (37,873)
Insights Discovered:
• Top Customers: Top 5 customers by sales identified for account management priority
• Product Performance: Top 5 products by profit revealed inventory focus areas
• Regional Trends: Sales by region and segment breakdown supported strategic planning
#Excel #MicrosoftExcel #DataAnalyst #SalesAnalysis #ExcelDashboard #BusinessIntelligence #DataVisualization #PivotTables #RemoteWork #DashboardDevelopment
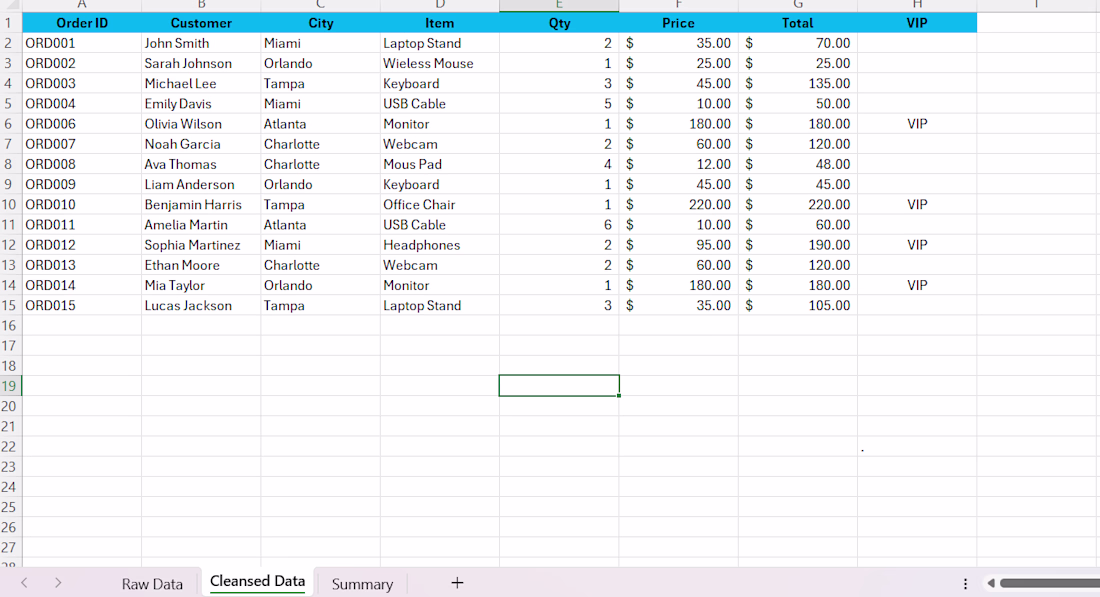
Show us the raw data! 😄
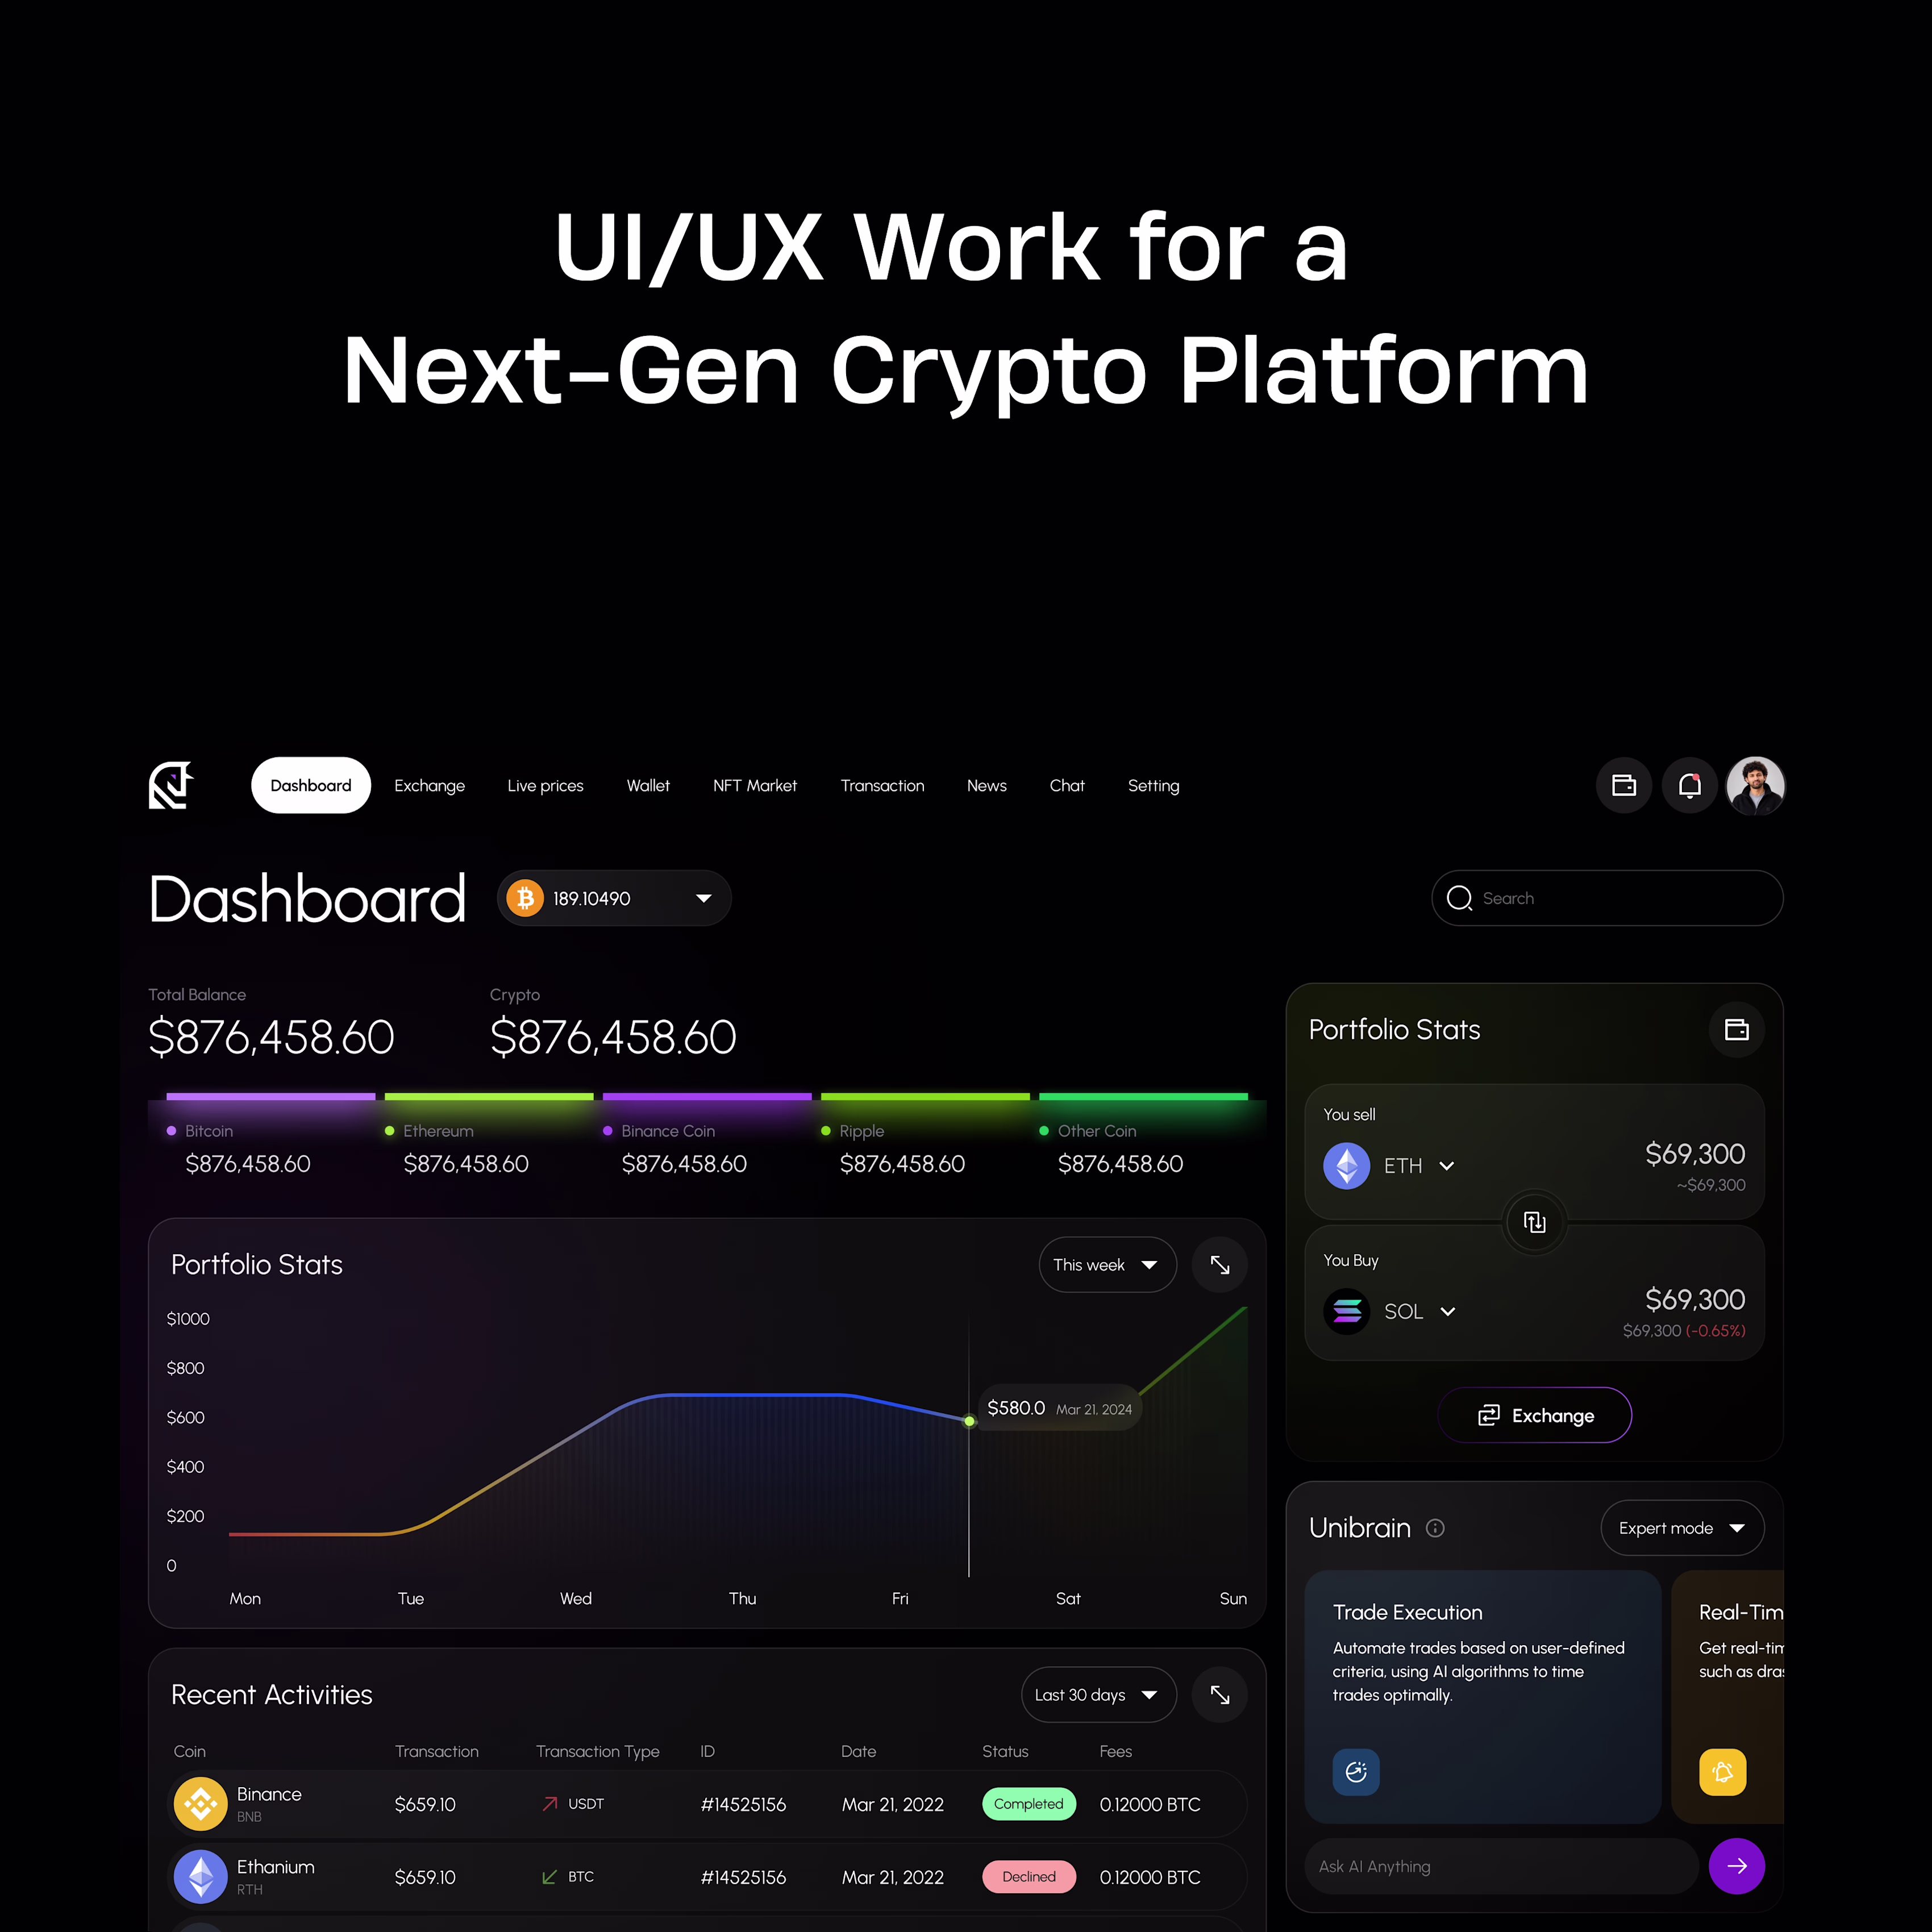
Designed the dashboard for a next-gen crypto platform 🚀 Clean data visualization, real-time portfolio tracking, and an AI-powered trade assistant, built to make complex crypto data feel simple and intuitive. Designed in Figma with a bold, dark UI aesthetic.
Challenges
View allTrending
Claude
Claude has entered the design space. How are you using Claude Design?
Contra University
Learn from expert creatives how to earn more using next-gen AI tools.
fifaworldcup2026
The World Cup is here and the whole world's watching. How are you designing for the world stage?
creativeaiflow
Creative AI workflows are evolving. What tools do you use, and what are their strengths and weaknesses?
freelancerlife
Freelancer life is wins, pivots, and everything in between. What’s yours right now?