The network for creativity
Join 1.25M professional creatives like you
Connect with clients, get discovered, and run your business 100% commission-free
Creatives on Contra have earned over $150M and we are just getting started
Back to feedPost

$23K spent. 2,760 purchases. 8.22x ROAS.
One thing I learned from an account which I managed was that the campaign wasn’t successful because I found one “magic” audience/adcopy or creative.
I tested creatives, audiences, and campaign structures, watched what was actually generating purchases, and moved the budget toward the combinations that were working.
The important part wasn’t launching more ads.
It was figuring out why some ads were converting, and others weren’t.
This is the kind of analysis I focus on when managing e-commerce Meta Ads.
#metaads #facebookads #instagramads


The network for creativity
Join 1.25M professional creatives like you
Connect with clients, get discovered, and run your business 100% commission-free
Creatives on Contra have earned over $150M and we are just getting started





Related posts

200 reactions look great, but what do they tell us?
As a content and social media manager, I look beyond the engagement count: are we reaching the people we want to reach and getting the response we’re aiming for?
If the goal is to generate product interest, I’d rather see 20 people asking about the product than 200 simply liking the video.
Both can be valuable, but the goal determines which matters more.
Which audience would you rather build?
3 voted
27%
8 voted
73%
11 votes
Closed

High interest look massive

Local Business Lead Generation Ad
A short-form social media ad created to help a local business attract more leads through Instagram.
The video highlights a simple advertising strategy designed to help businesses reduce their reliance on Yelp, word-of-mouth referrals, and highly competitive Google search results.
My role: Video Editing, Motion Graphics, Typography, B-Roll & Visual Storytelling
The goal was to create a fast-paced, engaging video that clearly communicates the strategy and encourages local business owners in St. Augustine to take action


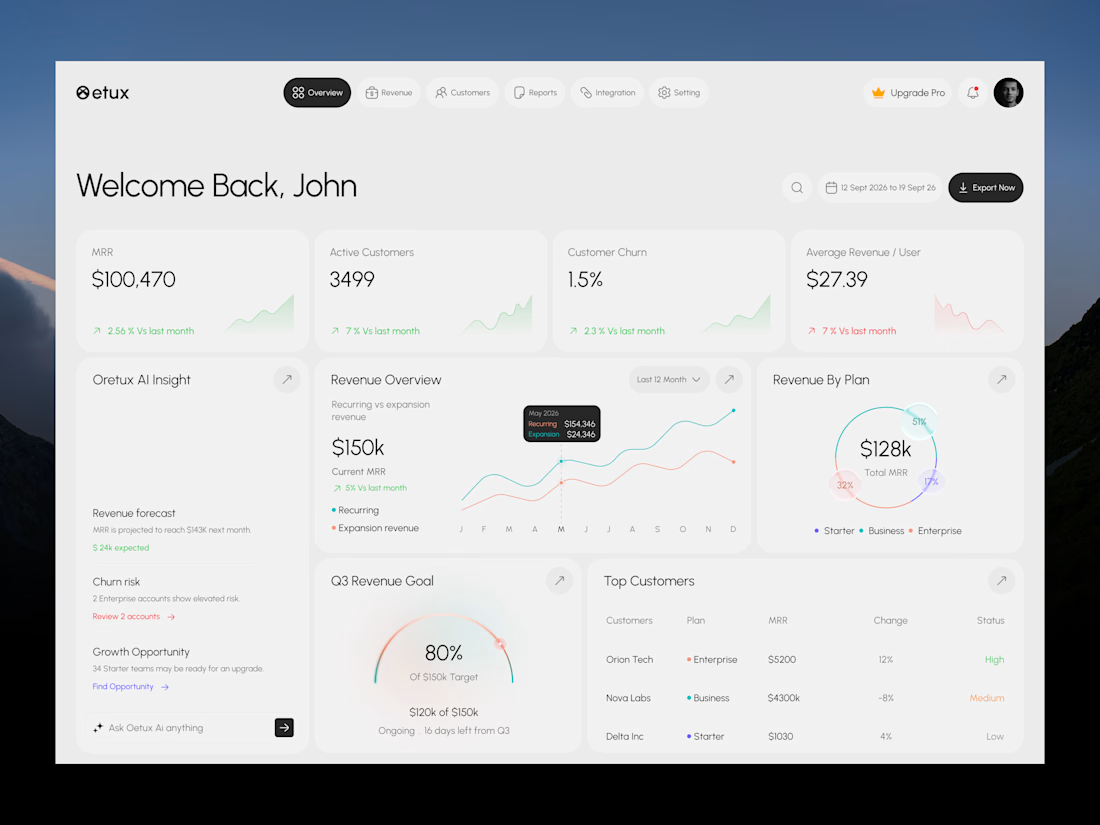
Oetux – SaaS Revenue Analytics Dashboard
The client had a lot of data, but the real problem was making sense of it.
MRR, revenue, churn, active customers, growth, customer performance, goals. Every metric was important, but when everything gets the same attention, users don’t know where to look first.
The existing experience made users spend too much time switching between information and trying to connect the numbers.
So we focused on how SaaS teams actually read their business data. We structured Oetux around the questions that matter most.
How is revenue performing?
Are we growing?
Are customers staying?
Where are we losing revenue?
What needs attention right now?
Then we organized KPIs, revenue trends, customer performance, churn insights, goals, and AI powered insights into one clear experience.
The goal wasn’t to remove data.
It was to organize the data so users could understand it faster.
That’s what we solved with Oetux.
Turning a data heavy SaaS dashboard into an experience that helps teams see their business clearly and make better decisions.



Love the clean layout.