The network for creativity
Join 1.25M professional creatives like you
Connect with clients, get discovered, and run your business 100% commission-free
Creatives on Contra have earned over $150M and we are just getting started
Back to feedPost
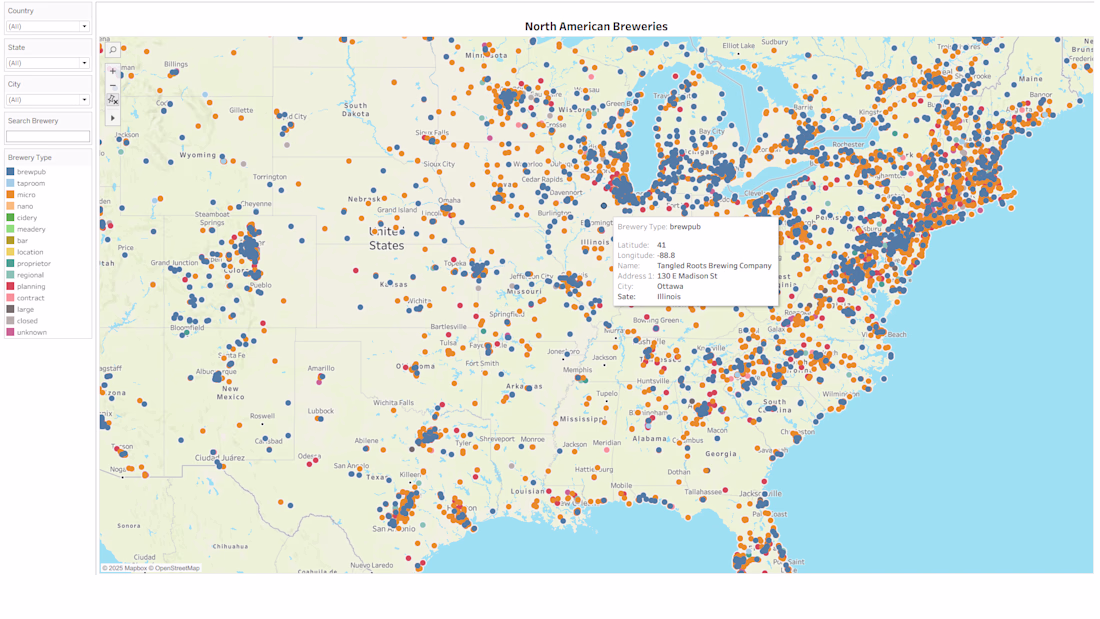
This project visualizes over 9,000 breweries across the United States and Canada using Tableau. I built a Python data pipeline that gathers and merges brewery data from OpenBreweryDB, OpenStreetMap, and Google Places, then cleans and normalizes it before publishing to Google Sheets for Tableau integration. The finished dashboard allows users to explore breweries by state, province, and city with interactive search and map filtering. It highlights practical ETL automation, geospatial data cleanup, and modern visualization design. View Live
The network for creativity
Join 1.25M professional creatives like you
Connect with clients, get discovered, and run your business 100% commission-free
Creatives on Contra have earned over $150M and we are just getting started
Trending
Claude
Claude has entered the design space. How are you using it?
Contra University
Learn from expert creatives how to earn more using next-gen AI tools.
Brand Design
The best brand designers are on Contra. Scroll to see what's trending in brand design. What are you building?
creativeaiflow
Creative AI workflows are evolving. What tools do you use, and what are their strengths and weaknesses?
freelancerlife
Freelancer life is wins, pivots, and everything in between. What’s yours right now?