The network for creativity
Join 1.25M professional creatives like you
Connect with clients, get discovered, and run your business 100% commission-free
Creatives on Contra have earned over $150M and we are just getting started
Back to feedPost

Shopify Sales Performance & Analytics | E-commerce Dashboard
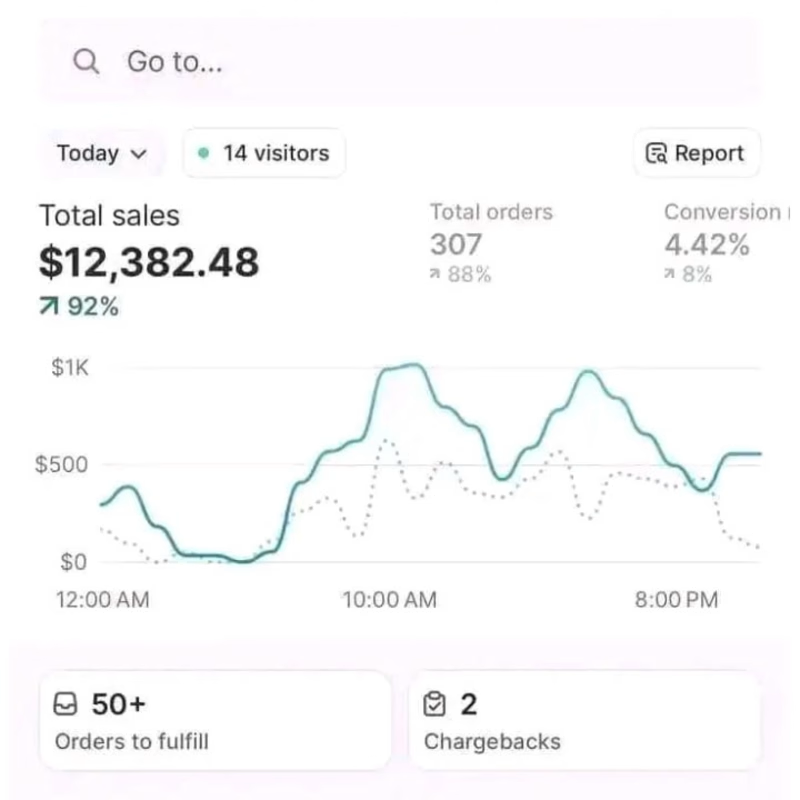
This Shopify analytics dashboard showcases key e-commerce performance metrics, including total sales, order volume, conversion rate, and daily sales trends. The screenshot displays $12,382.48 in total sales, 307 orders, and a 4.42% conversion rate for the selected reporting period.
The dashboard provides a clear overview of store performance, helping business owners monitor revenue, track order activity, and understand how effectively visitors convert into customers. The sales charts and performance indicators offer useful insights for evaluating store activity and identifying opportunities to improve the shopping experience.
Key Metrics Displayed:
Total Sales: $12,382.48
Total Orders: 307
Conversion Rate: 4.42%
Sales Growth: 92%
Orders Growth: 88%
Conversion Rate Growth: 8%
Daily sales performance graph
Order fulfillment and chargeback overview
Skills: Shopify Analytics, E-commerce Management, Sales Reporting, Conversion Rate Analysis, Shopify Store Management.
The network for creativity
Join 1.25M professional creatives like you
Connect with clients, get discovered, and run your business 100% commission-free
Creatives on Contra have earned over $150M and we are just getting started
Related posts

E-commerce admin dashboard with KPIs, revenue charts and order management in one clean view.


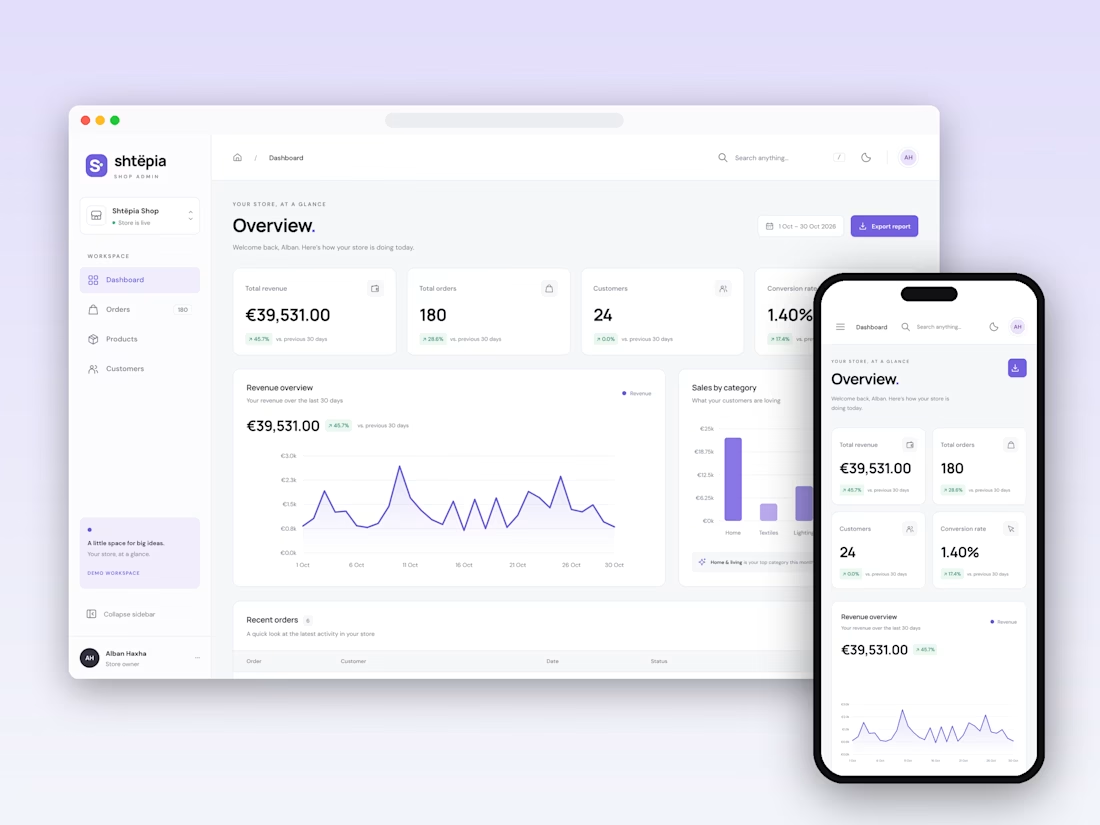

Keeping KPIs, revenue and orders in one view is hard to balance. Which one did you place first, and why?

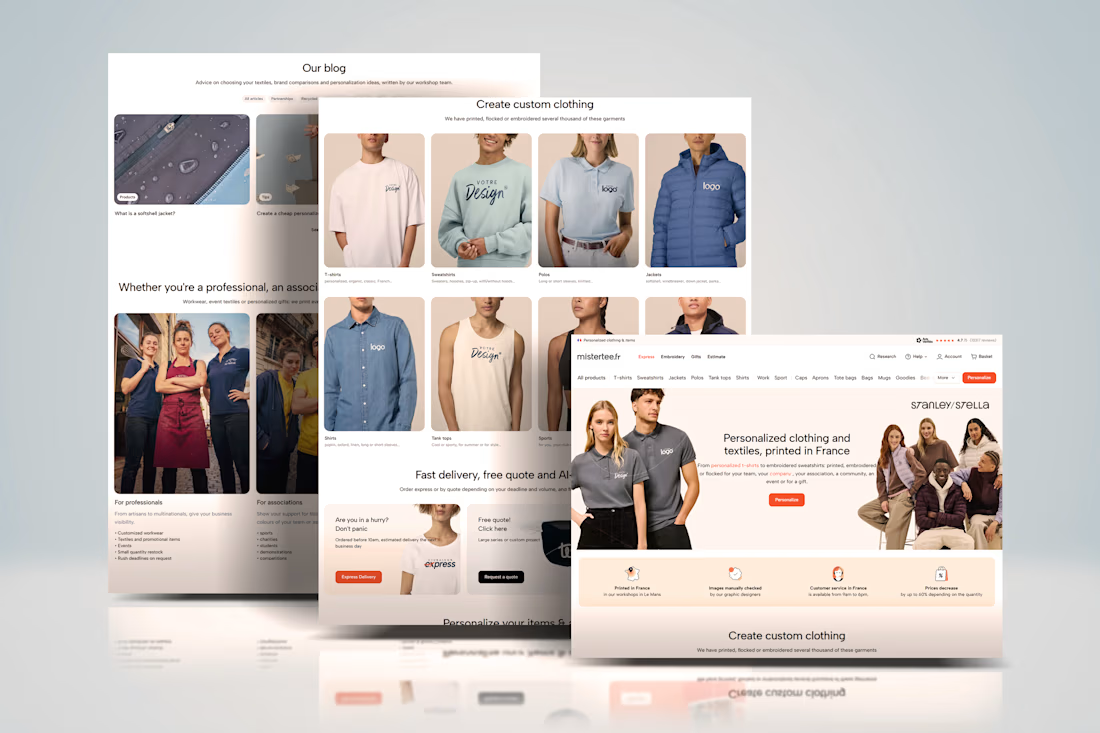
Designed a premium Shopify ecommerce storefront for a quiet luxury fashion brand offering timeless clothing for men and women. The website features an elegant hero banner, men's and women's bestsellers, curated seasonal collections, product grids, outfit inspiration, shoppable video content, customer testimonials, brand features, and a clean navigation system for exploring different clothing styles.
The goal was to create a refined and user-friendly shopping experience that reflects the brand's understated aesthetic, presents its clothing collections clearly, and helps customers discover outfit ideas, browse products, and shop with confidence.


flawless


Google Ads for Bag Brand • 3.2X ROAS in Last 30 Days
I helped my own store Adiora Mart ($20 bag store) achieve:
✅ 3.2X ROAS
✅ 126 Purchases in 30 days
✅ $31.84 AOV, $9.89 Cost / Conversion
✅ 【entity-Shopify¦canonical_name=Shopify】 Dashboard Verified
How? I rebuilt the account:
Fixed Merchant Center feed (GTIN + Size + Color)
Restructured Shopping + PMax into 3 asset groups by margin
Added 1,200 negative keywords to cut 70% wasted spend
Fixed GA4 + GTM conversion tracking
This is NOT a screenshot — it's my own store's live data.
Need help scaling your 【entity-Shopify¦canonical_name=Shopify】 bag / fashion brand with Google Ads? DM me your store link — I'll share a 3-min Loom audit.
#googleads #【entity-shopify¦canonical_name=Shopify】 #roas #ecommerce #adionamart #footwear #bagbrand #performanceMarketing