The network for creativity
Join 1.25M professional creatives like you
Connect with clients, get discovered, and run your business 100% commission-free
Creatives on Contra have earned over $150M and we are just getting started
Back to feedPost
Data Cleaning and Sales Analysis
## Project Overview
This project demonstrates an end-to-end data cleaning and exploratory data analysis (EDA) workflow using Python.
The dataset was intentionally generated with multiple data quality issues to simulate real-world business scenarios commonly encountered by Data Analysts and Data Scientists.
---
## Objectives
- Identify data quality issues.
- Handle missing values.
- Remove duplicate records.
- Standardize mixed date formats.
- Perform exploratory data analysis.
- Generate business insights.
- Create visualizations for decision-making.
---
## Dataset Issues
The raw dataset contained several intentional problems:
- Missing values in `Qty`
- Missing values in `Harga`
- Duplicate transactions
- Mixed date formats
- Inconsistent category naming
---
## Data Cleaning Process
The following steps were performed:
1. Loaded and profiled the raw dataset.
2. Identified missing values and duplicate records.
3. Removed duplicate transactions.
4. Filled missing values using median imputation.
5. Investigated mixed date formats.
6. Built a custom date parser to standardize dates.
7. Saved the cleaned dataset.
---
## Results
### Before Cleaning
| Metric | Value |
|----------|---------|
| Total Records | 1009 |
| Missing Qty | 8 |
| Missing Harga | 5 |
| Duplicate Records | 10 |
# After Cleaning
| Metric | Value |
|----------|---------|
| Total Records | 999 |
| Missing Qty | 0 |
| Missing Harga | 0 |
| Duplicate Records | 0 |
| Failed Date Parsing | 0 |
---
## Business Insights
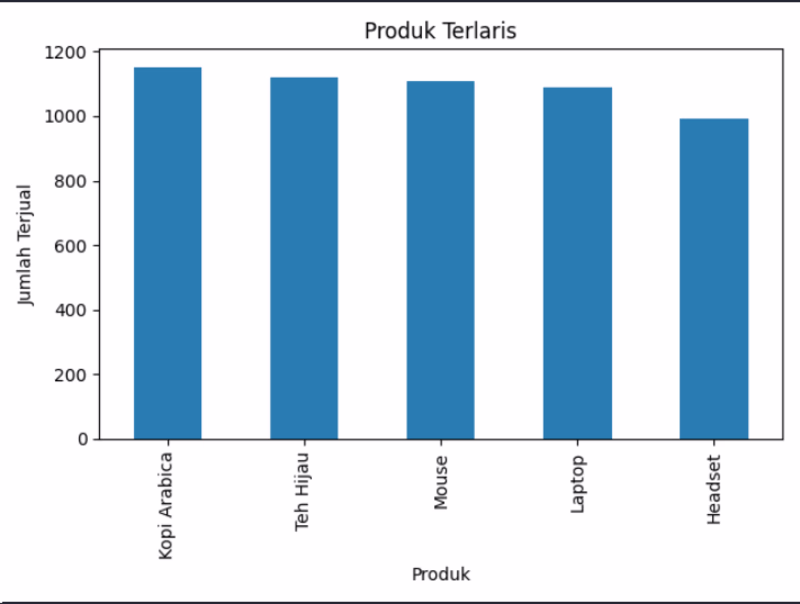
### Best-Selling Products
Kopi Arabica was the top-selling product, followed by Teh Hijau and Mouse.
### Sales by City
Bandung generated the highest sales volume, indicating strong market potential compared to Surabaya and Jakarta.
### Category Performance
Electronics dominated sales performance.
An inconsistency between `Makanan` and `makanan` was discovered, highlighting the importance of data standardization before analysis.
### Revenue
The total revenue generated was:
Rp 13,593,130,000
## Technologies Used
- Python
- Pandas
- NumPy
- Matplotlib
The network for creativity
Join 1.25M professional creatives like you
Connect with clients, get discovered, and run your business 100% commission-free
Creatives on Contra have earned over $150M and we are just getting started
Trending
Claude
Claude has entered the design space. How are you using it?
Contra University
Learn from expert creatives how to earn more using next-gen AI tools.
Brand Design
The best brand designers are on Contra. Scroll to see what's trending in brand design. What are you building?
creativeaiflow
Creative AI workflows are evolving. What tools do you use, and what are their strengths and weaknesses?
freelancerlife
Freelancer life is wins, pivots, and everything in between. What’s yours right now?
Related posts
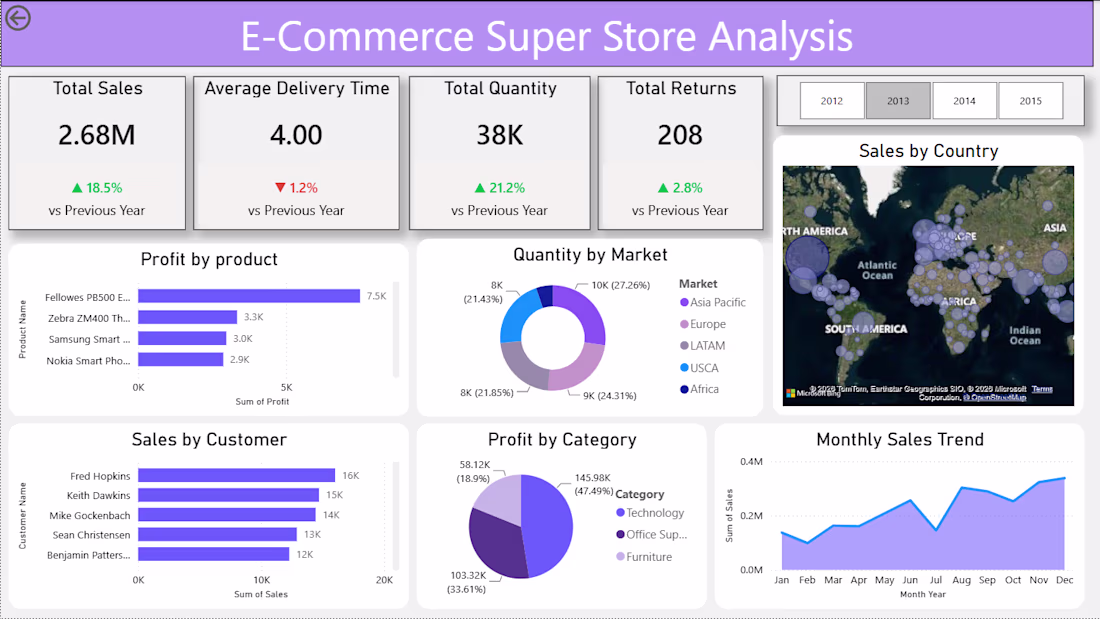
E-Commerce Super Store Sales Dashboard
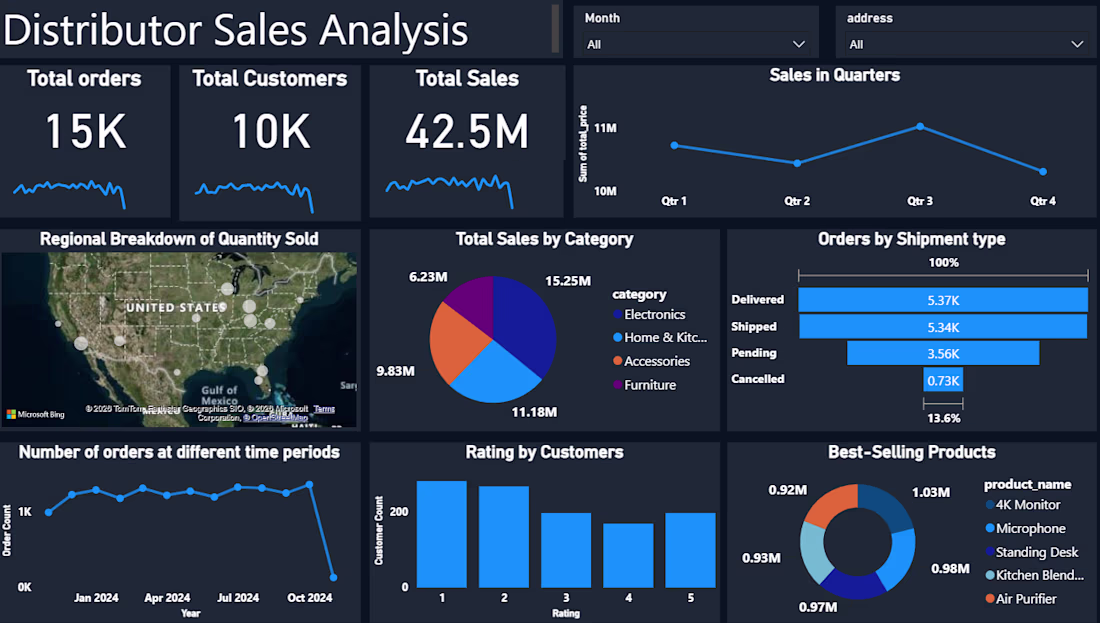
Developed an interactive Power BI dashboard to analyze sales performance, profitability, customer trends, and operational KPIs for an e-commerce business. The dashboard provides decision-makers with real-time insights into sales growth, product performance, returns, and regional trends through dynamic and visually engaging reports.
Key Highlights
Designed an executive-style dashboard with an intuitive user experience
Built dynamic KPIs using DAX for Sales, Quantity, Returns, and Delivery Performance
Cleaned and transformed data using Power Query
Created an optimized data model for accurate and efficient reporting
Implemented interactive filters, cross-filtering, and time-based analysis
Visualized sales by country, product, category, customer, market, and monthly trends.
Skills Used
Power BI • DAX • Power Query • Data Modeling • ETL • Sales Analytics • KPI Development • Data Visualization • Business Intelligence
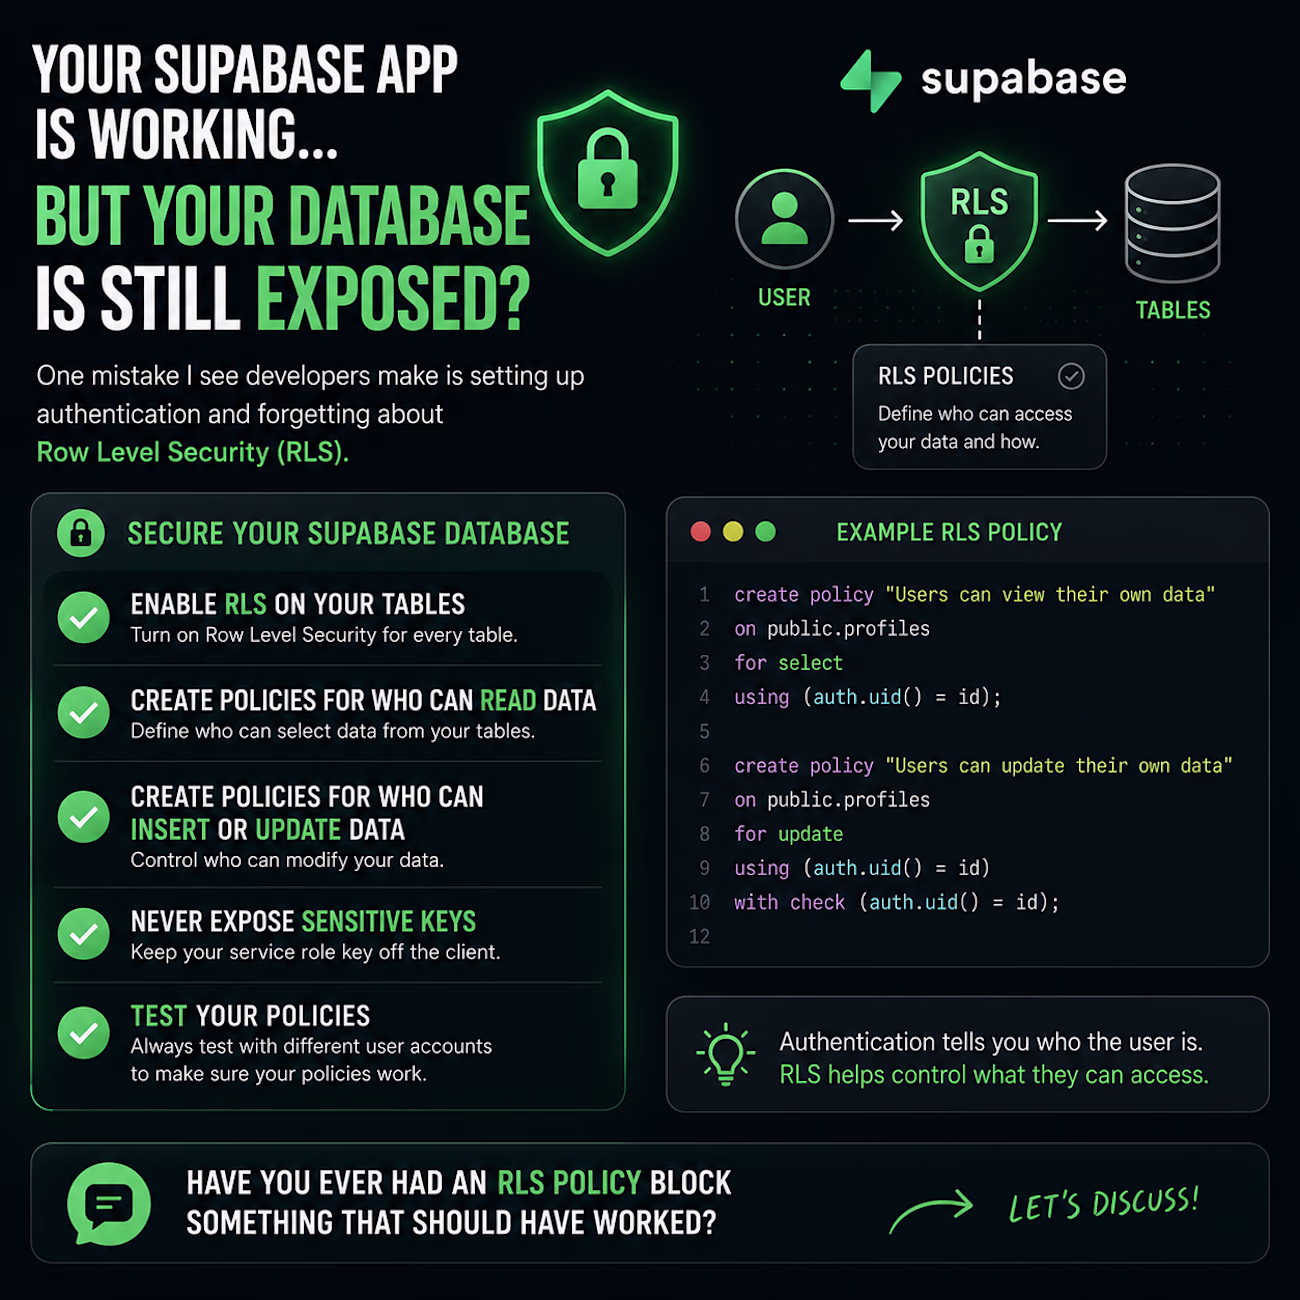
Your Supabase app is working… but your database is still exposed? 🔐
One mistake I see developers make is setting up authentication and forgetting about Row Level Security (RLS).
If you're using Supabase, don't just create your tables and move on.
Make sure you:
✅ Enable RLS on your tables
✅ Create policies for who can read data
✅ Create policies for who can insert or update data
✅ Never expose sensitive service keys in the frontend
✅ Test your policies with different user accounts
Authentication tells you who the user is. RLS helps control what they can access.
Have you ever had an RLS policy block something that should have worked? 👇
Impressive, thanks for the tips love ❤️
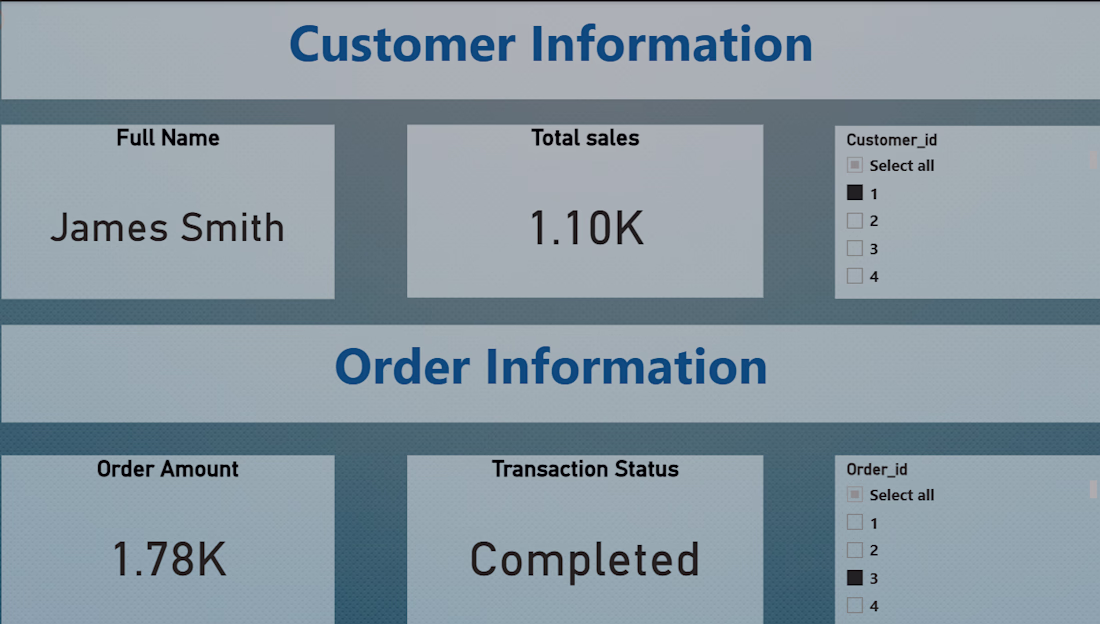
Sales Analytics Dashboard
Designed an interactive Power bi Dashboard to help track sales performance, revenue, profit, and business trends in a simple and visually clear way. The dashboard includes KPI cards, regional and category-wise analysis, trend tracking, and dynamic filters for better insights and decision-making. Built using Power BI, DAX, Power Query, and data visualization techniques with a clean and user-friendly layout.