The network for creativity
Join 1.25M professional creatives like you
Connect with clients, get discovered, and run your business 100% commission-free
Creatives on Contra have earned over $150M and we are just getting started
Back to feedPost
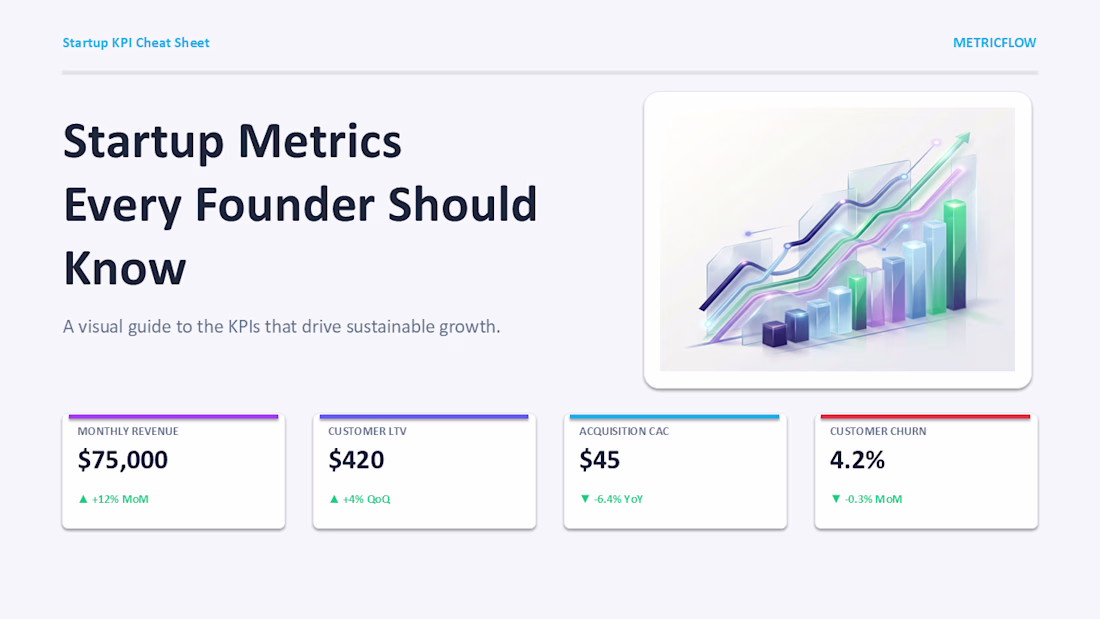
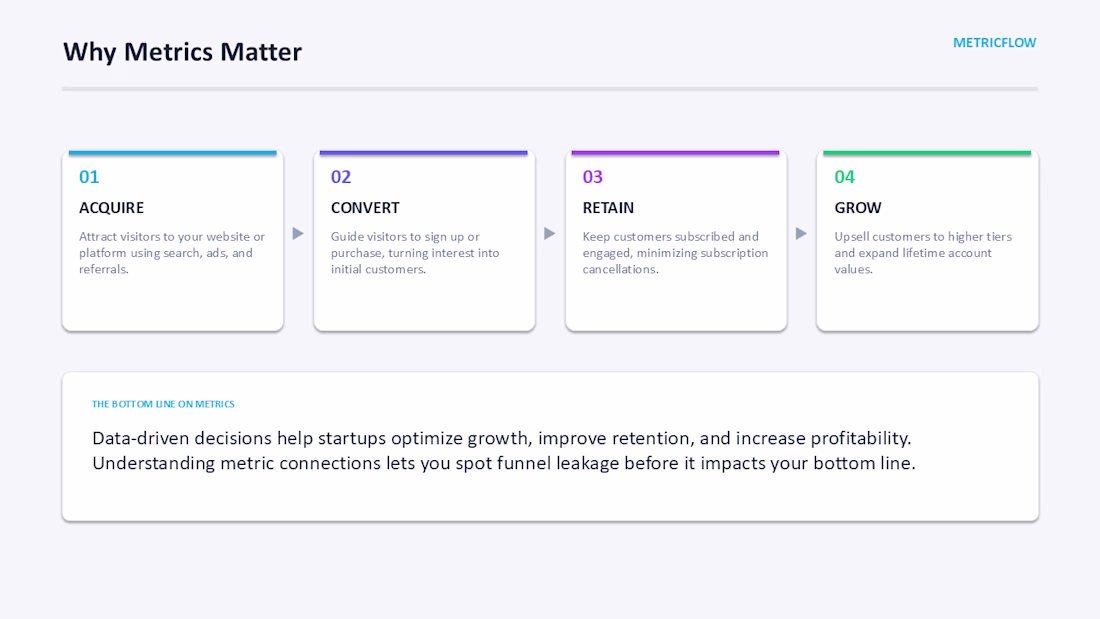
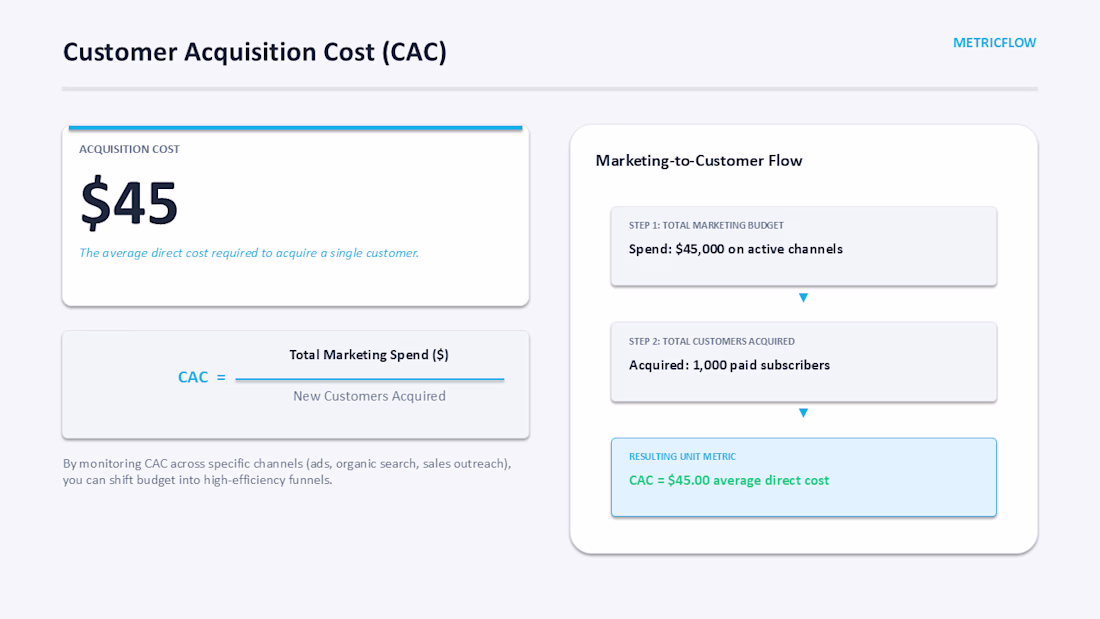
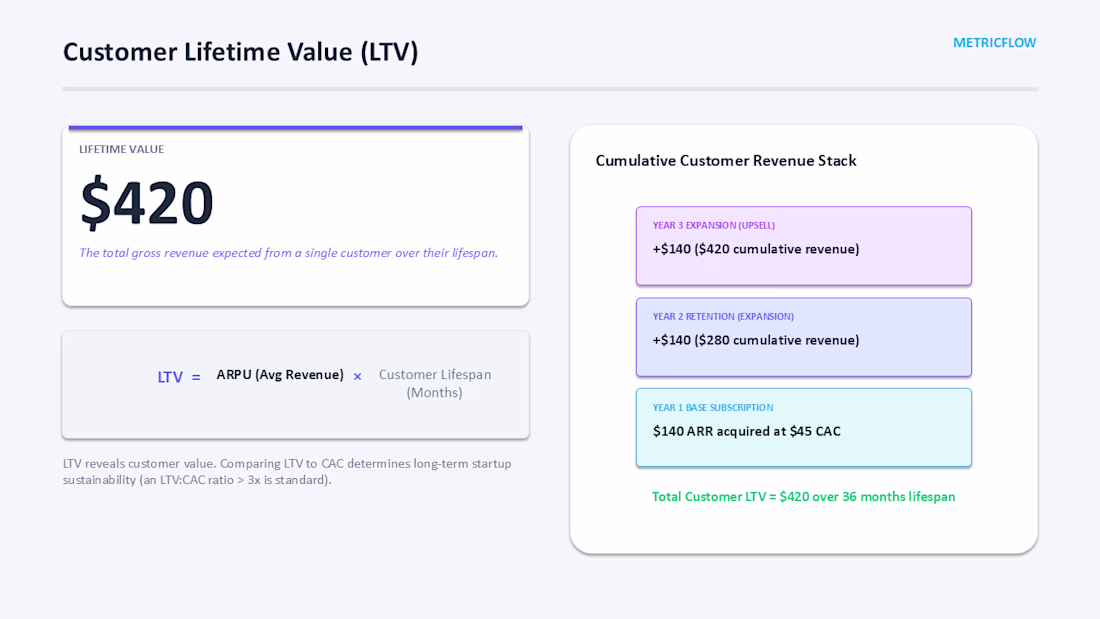
A business-focused infographic and data visualization project designed to simplify key startup KPIs through clear visual storytelling. This project explains essential metrics such as CAC, LTV, MRR, Churn Rate, and Conversion Rate using dashboard elements, process flows, and executive reporting layouts. The goal was to transform complex business data into actionable insights that are easy to understand and communicate.
The network for creativity
Join 1.25M professional creatives like you
Connect with clients, get discovered, and run your business 100% commission-free
Creatives on Contra have earned over $150M and we are just getting started
Trending
Claude
Claude has entered the design space. How are you using it?
Contra University
Learn from expert creatives how to earn more using next-gen AI tools.
Brand Design
The best brand designers are on Contra. Scroll to see what's trending in brand design. What are you building?
creativeaiflow
Creative AI workflows are evolving. What tools do you use, and what are their strengths and weaknesses?
freelancerlife
Freelancer life is wins, pivots, and everything in between. What’s yours right now?
Related posts
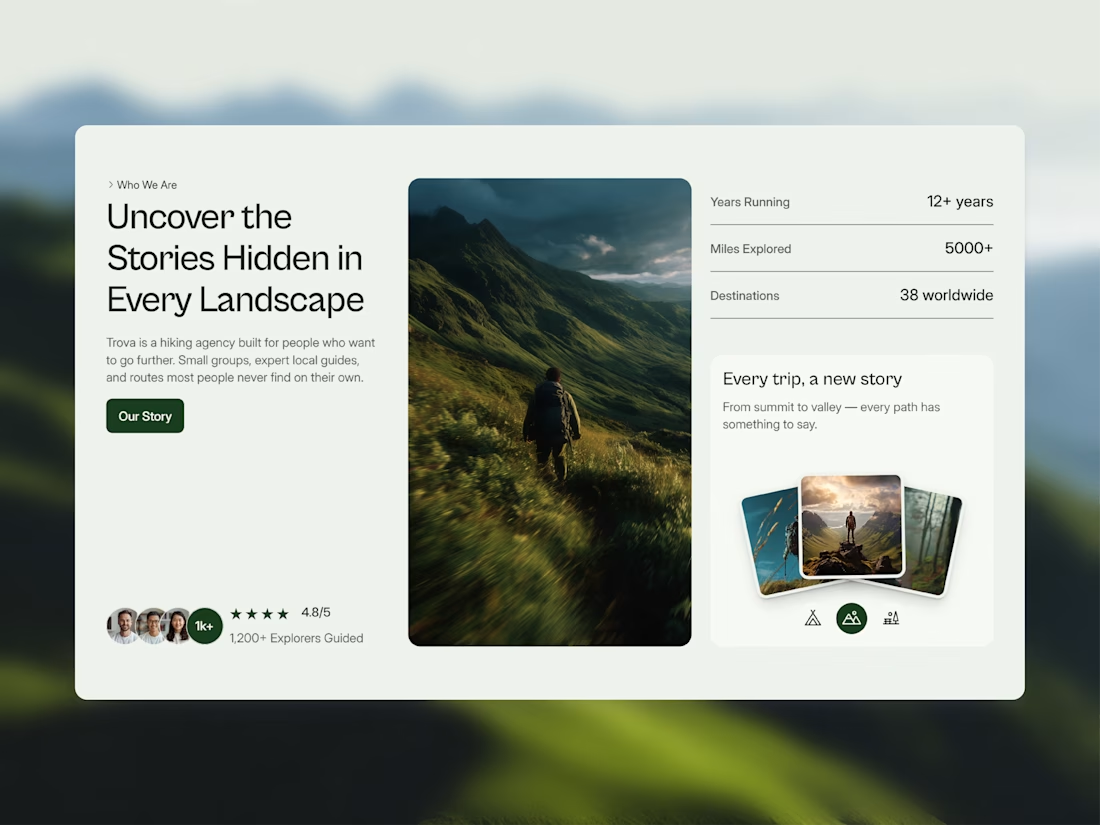
One of my favorite sections from Trova. 🌿
Rather than creating a standard About page, I focused on designing a Who We Are section that builds trust at first glance through storytelling, key metrics, social proof, and carefully selected imagery.
It's a small section, but one that plays a big role in shaping the overall experience.
Feedback is always appreciated! ✨
🌿 Explore Trova live: https://trova-travel.framer.website/
look really nice and stunning
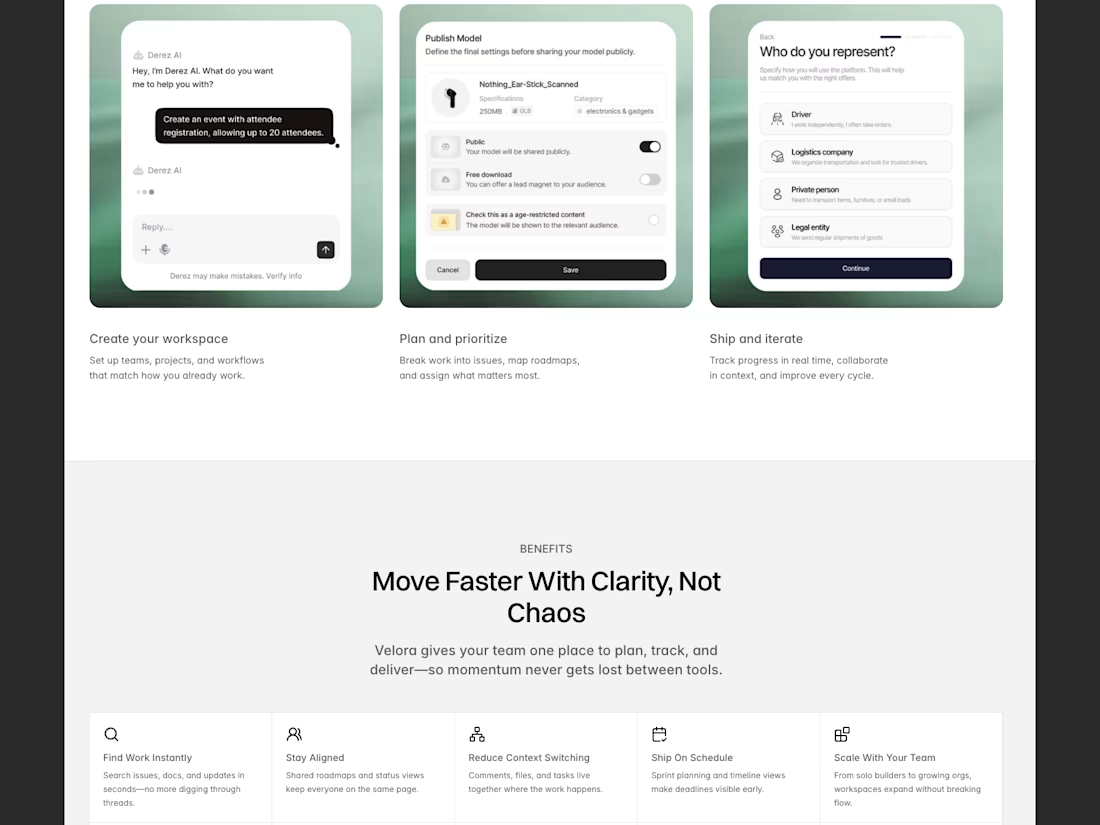
Sprintline — AI Project Management SaaS
Sprintline is a modern project management SaaS template designed for startups, agencies, and software teams that need a clean, scalable workspace to plan, track, and deliver projects. Built entirely in Framer, the template combines editorial design with conversion-focused layouts, making it ideal for SaaS businesses launching new products.
Rather than creating another generic dashboard template, the goal was to design a product that feels premium, fast, and intuitive while showcasing how modern teams organize work—from sprint planning to roadmap management and team collaboration.
The Challenge
Most project management templates are visually cluttered, overloaded with UI elements, and lack a clear marketing experience. The challenge was to create a landing page that balances product storytelling with a realistic dashboard preview, helping visitors quickly understand the value of the platform.
The design also needed to meet Framer Marketplace standards by being responsive, reusable, and easy to customize without requiring code.
Design Process
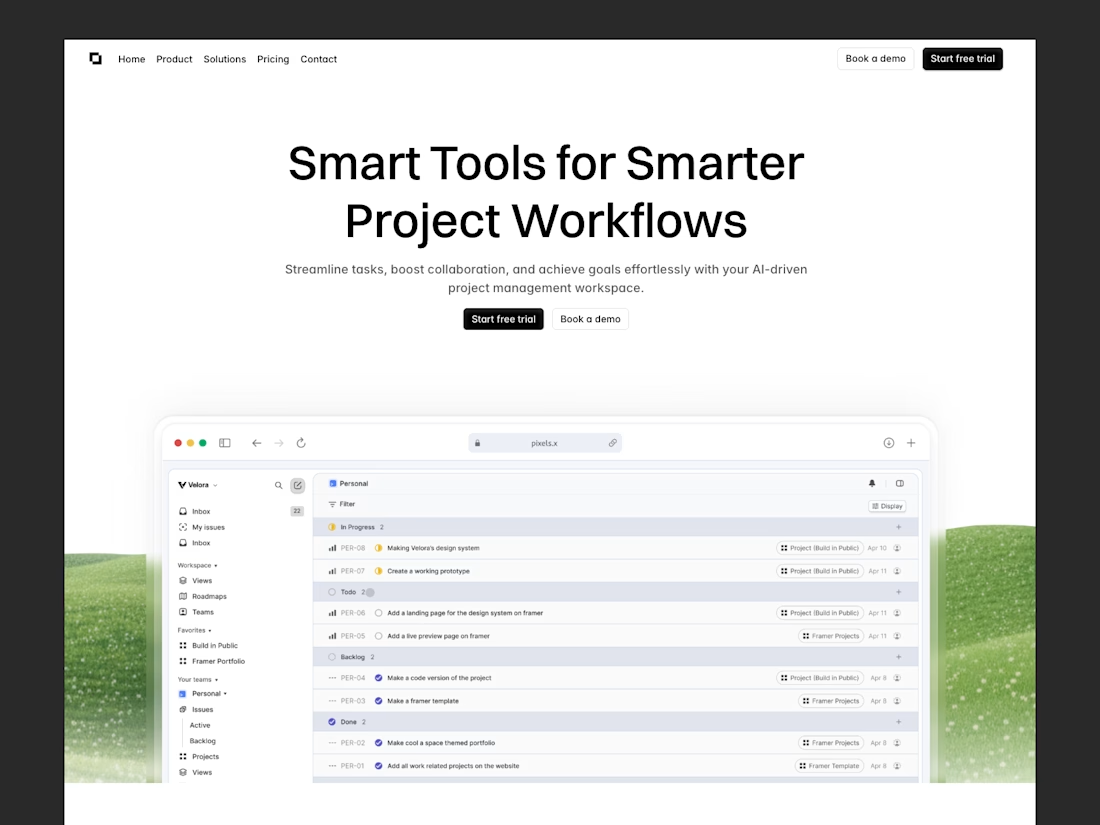
I started by researching leading project management platforms and identifying common user expectations. The experience was structured to guide visitors through the product naturally:
Introduce the core value proposition
Showcase realistic product interfaces
Highlight key workflow features
Explain team benefits
Drive users toward conversion with clear CTAs
The interface uses generous whitespace, clean typography, subtle shadows, and minimal color accents to keep the focus on the product.
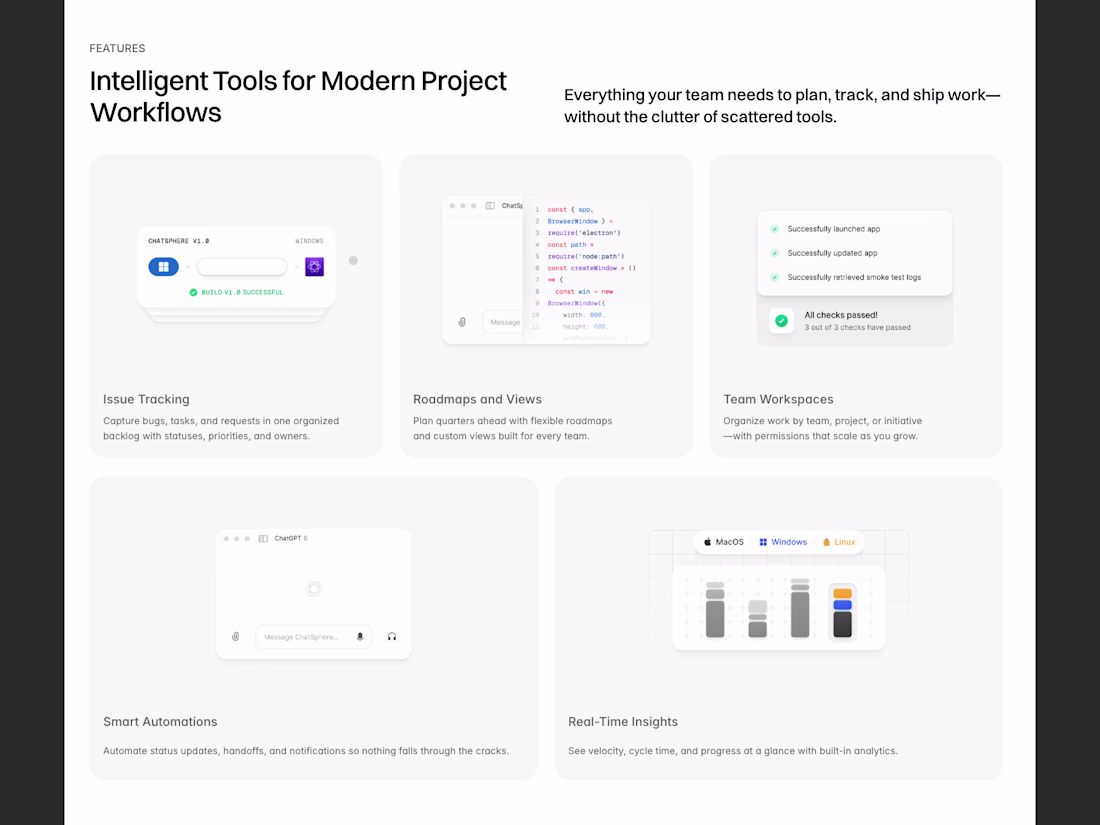
Key Features
AI-powered project management landing page
Sprint planning and backlog management
Roadmap and timeline showcase
Team collaboration workflows
Responsive dashboard mockups
Feature-rich marketing sections
Pricing, FAQs, testimonials, and CTA sections
Fully responsive across desktop, tablet, and mobile
Built with reusable Framer components
Optimized for performance and SEO
Design Highlights
The visual identity follows a minimal, editorial-inspired aesthetic with a strong emphasis on clarity and hierarchy. High-fidelity dashboard mockups were created to make the product feel authentic while maintaining a lightweight, modern interface.
Every section was designed to communicate value quickly, helping potential customers understand the product within seconds.
Outcome
Sprintline is a production-ready Framer template created for the Framer Marketplace. It provides startups and SaaS businesses with a polished marketing website that can be customized and launched quickly, reducing development time while maintaining a premium user experience.
The project demonstrates my ability to combine product strategy, UI design, marketing-focused layouts, and Framer development into a cohesive, launch-ready template.
I recently put together a small collection of banner designs for different types of campaigns: real estate, food advertising, event promotion, and logistics.
What I always find interesting with banners is how little space you actually have to make something work. You need to catch attention, explain the offer, keep the layout readable, and still make it feel on-brand.
Curious to hear your thoughts: which one feels the strongest visually? And which one would make you stop scrolling?