The network for creativity
Join 1.25M professional creatives like you
Connect with clients, get discovered, and run your business 100% commission-free
Creatives on Contra have earned over $150M and we are just getting started
Back to feedPost

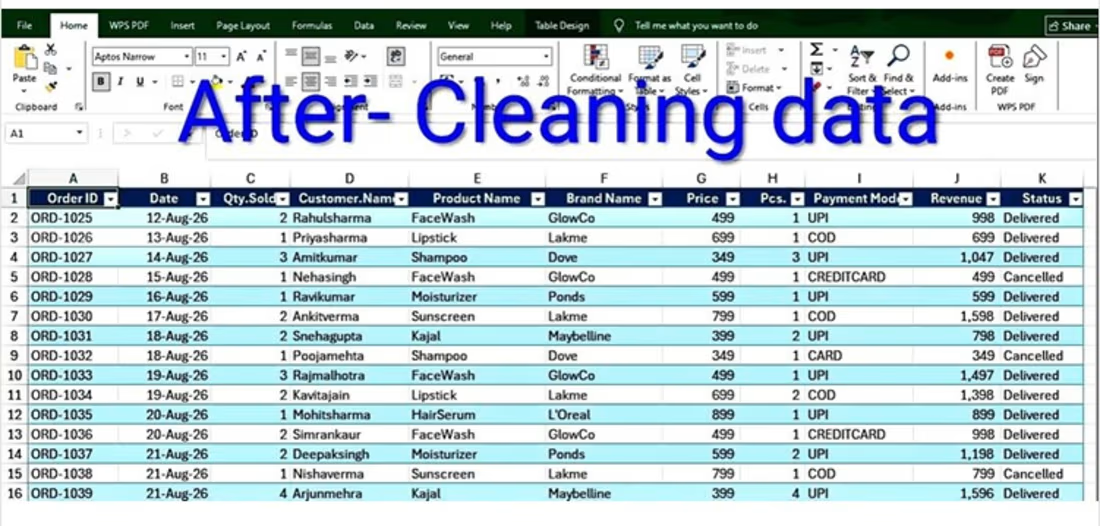
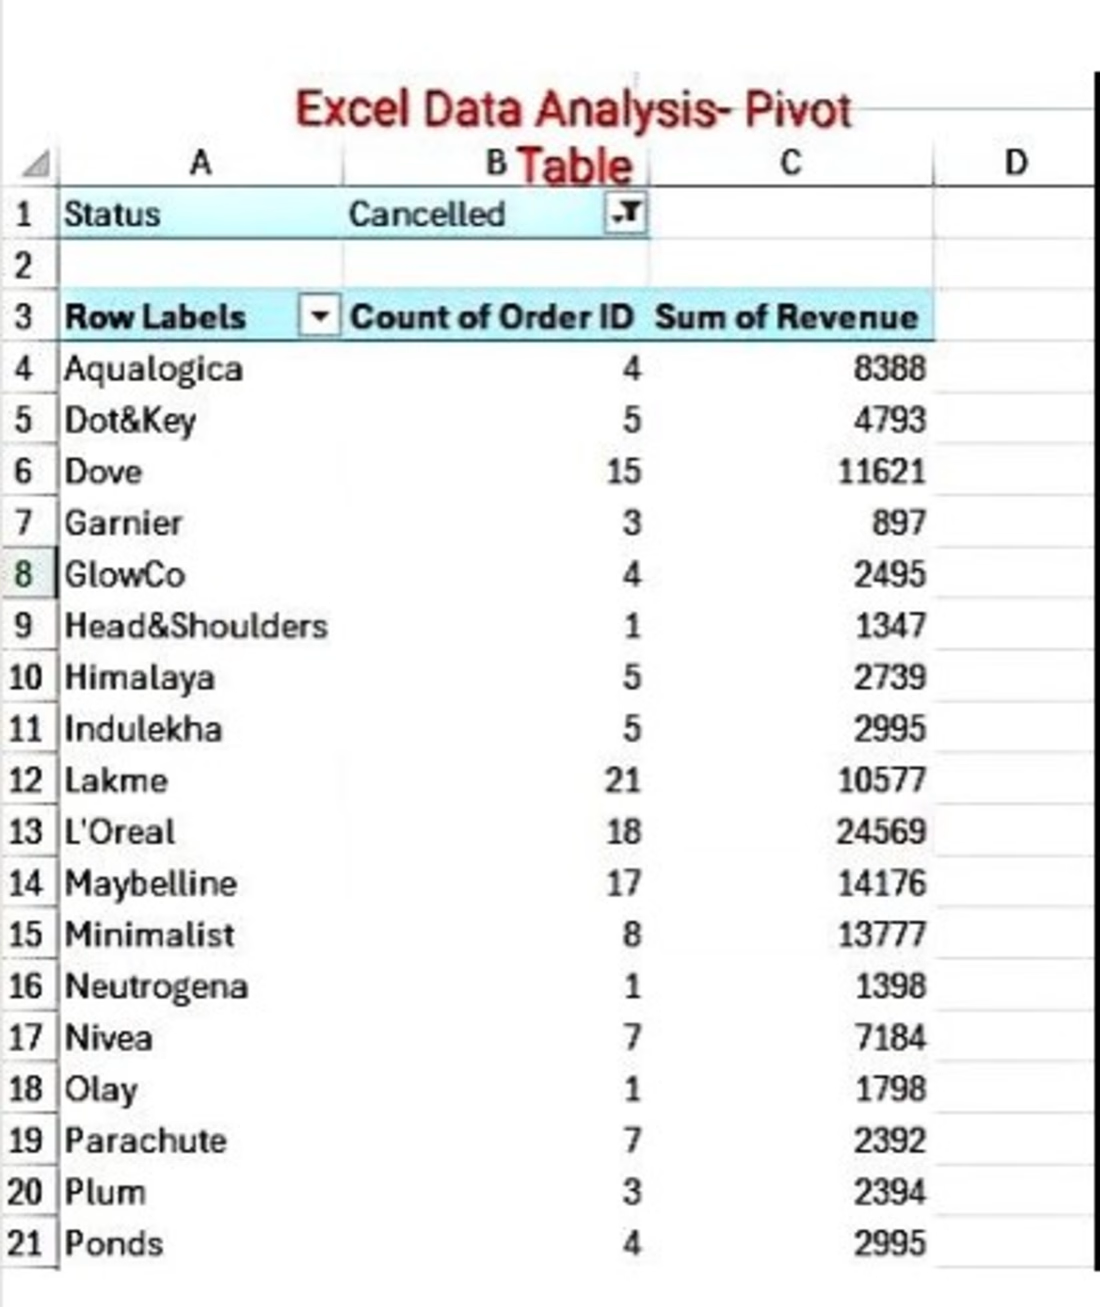
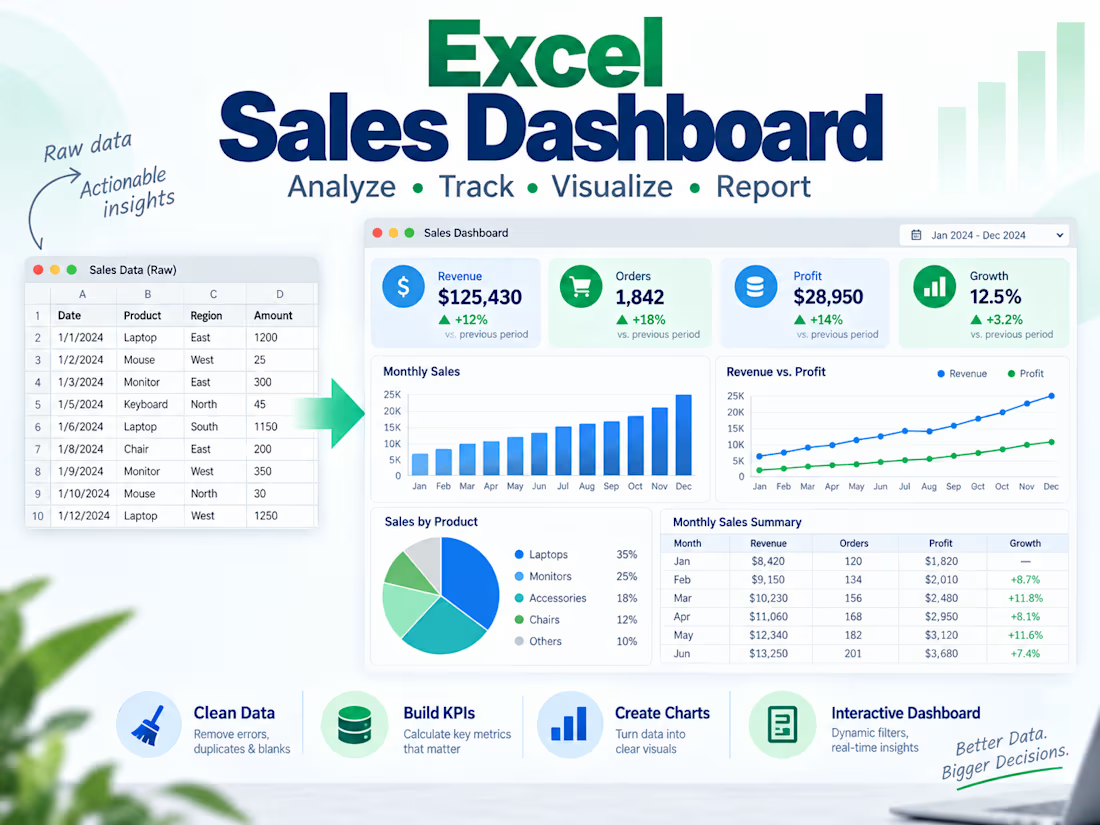
This sample project shows how I transform raw sales data into a clear and easy-to-read Excel dashboard.
I organized the dataset, created summary metrics and built visual reports to make business performance easier to understand.
Deliverables included:
sales data organization
KPI calculation
monthly performance analysis
top products and categories
charts and visual reporting
interactive Excel dashboard
This project uses fictional data created for demonstration purposes.


The network for creativity
Join 1.25M professional creatives like you
Connect with clients, get discovered, and run your business 100% commission-free
Creatives on Contra have earned over $150M and we are just getting started

Challenges
View all


Related posts



Adorable design! Fresh and vibrant!