The network for creativity
Join 1.25M professional creatives like you
Connect with clients, get discovered, and run your business 100% commission-free
Creatives on Contra have earned over $150M and we are just getting started
Back to feedPost

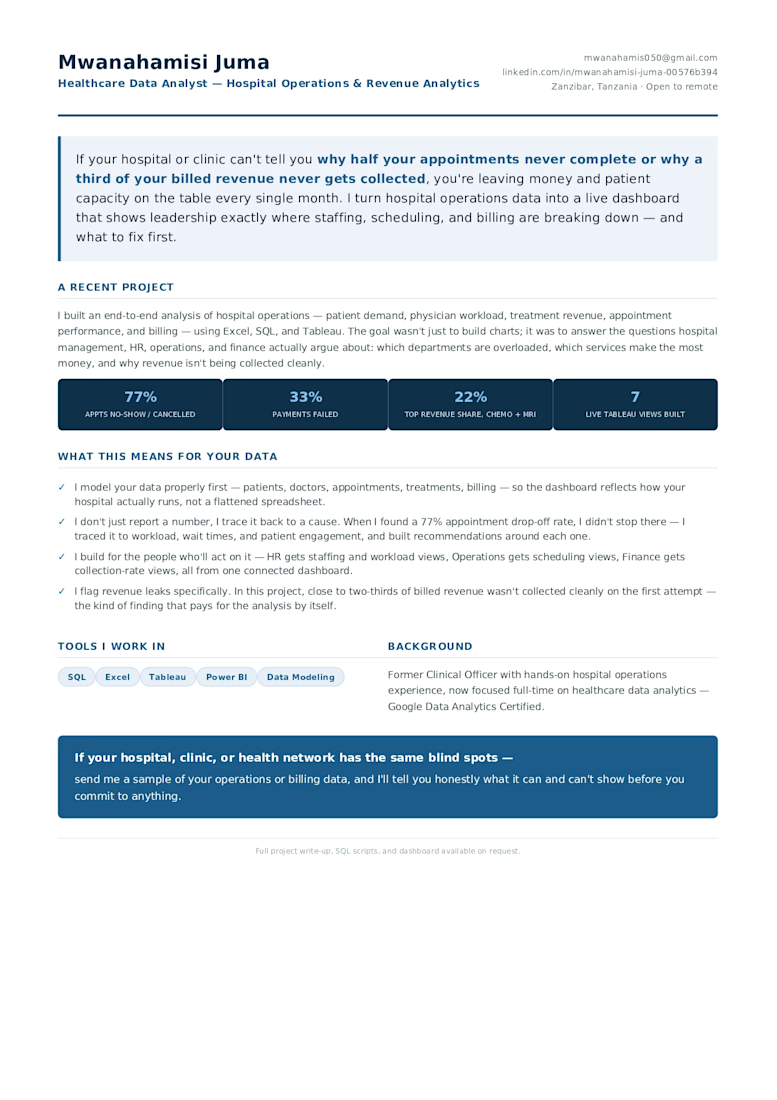
I analyzed a hospital's full operations picture — patient demand, physician workload, treatment costs, appointment performance, and billing — using Excel, SQL, and Tableau, to help hospital leadership see where things were quietly going wrong before the losses added up.
A few things stood out. Pediatrics and Dermatology carried the highest patient volume and physician workload — meaning a small group of doctors were absorbing most of the pressure, which is a staffing risk if any of them become unavailable. On the revenue side, Chemotherapy and MRI were the top earners (11.6% and 10.5% of total revenue), driven by cost and case complexity rather than sheer demand.
The bigger problems were in the pipeline itself: only 23% of appointments were actually completed, with 26% no-shows and 25.5% cancellations — nearly half the appointments never happened. And on the billing side, only 32% of revenue was cleanly collected; 34% sat pending and 33% failed outright. That's close to two-thirds of billed revenue not coming in on the first try.
So what does a hospital actually do with this? Based on the data, I recommended: investigating what's driving the near-50% no-show/cancellation rate and testing fixes like reminders or flexible rebooking; reviewing the billing workflow behind the pending/failed payments, since documentation and payer communication were the likely starting points; adding block scheduling or dedicated clinics for high-cost services like Chemotherapy and MRI to raise equipment utilization; and rebalancing appointment volume away from the Central branch, which was absorbing most of the demand while Eastside and Westside sat underused.
I built interactive Tableau dashboards so HR, Operations, and Finance could each track the KPIs relevant to their team in real time — turning a pile of scattered hospital data into something leadership could actually act on.


The network for creativity
Join 1.25M professional creatives like you
Connect with clients, get discovered, and run your business 100% commission-free
Creatives on Contra have earned over $150M and we are just getting started







Related posts

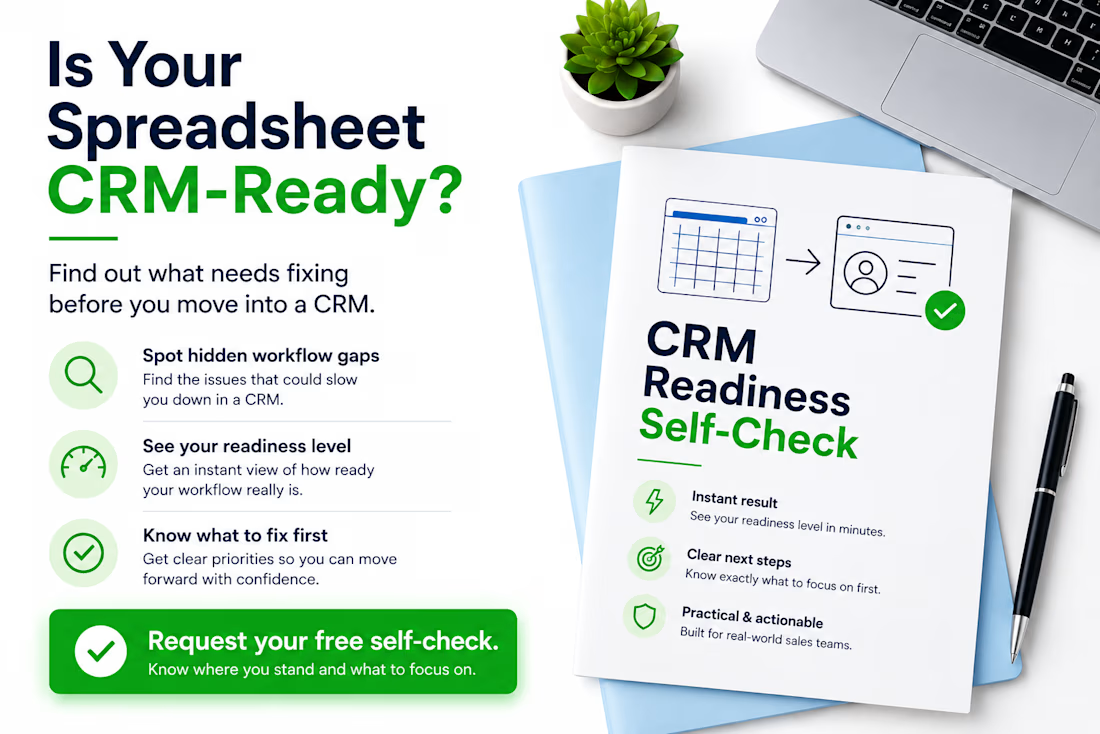
Thinking about moving from Excel or Google Sheets to a CRM? Don’t migrate the problems with the data.
Before choosing or configuring a CRM, I usually check five things:
• Does every active lead have a clear owner?
• Is there always a defined next action?
• Are follow-up dates consistently tracked?
• Are lead statuses clear and used consistently?
• Could another team member understand the spreadsheet without asking for help?
If several answers are “no”, the problem may not be the CRM yet — it may be the workflow behind it.
A CRM works much better when the sales process is clear before migration starts. I created a free CRM Readiness Self-Check for small teams that want to identify these gaps before investing more time or money in a CRM.
If you’re currently working from spreadsheets and considering a CRM, comment “CHECK” or send me a message and I’ll send it to you.
#CRM #CRMReadiness #SalesOperations #RevOps #WorkflowOptimization #GoogleSheets #Excel #BusinessProcess


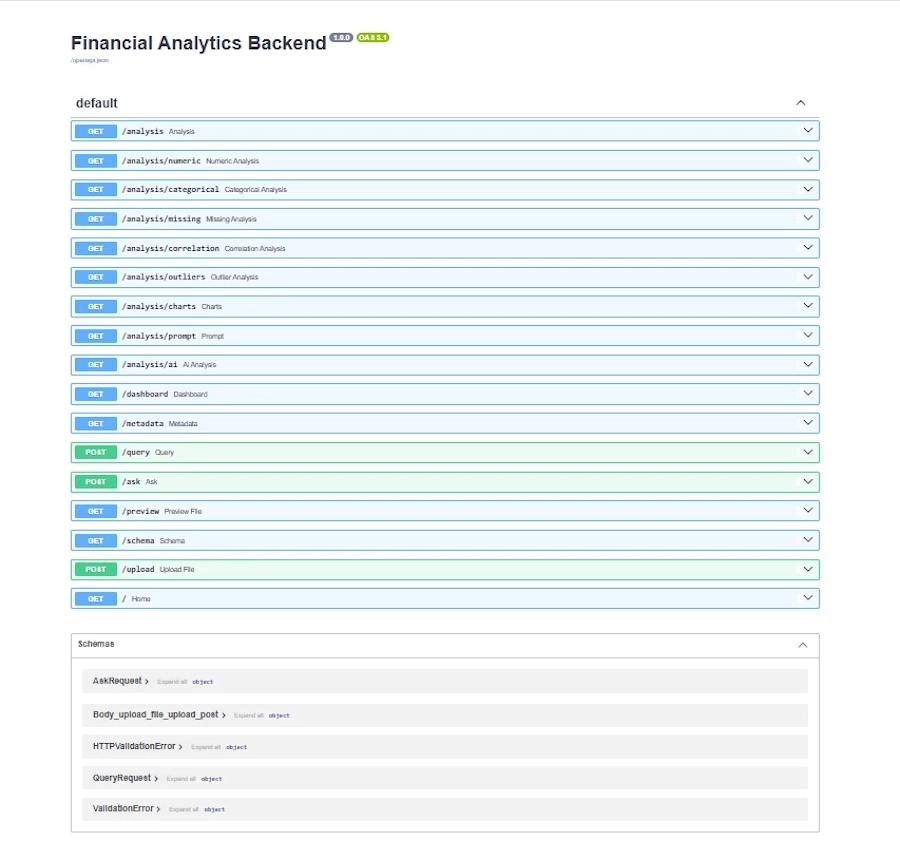
AI-powered financial analytics platform built with FastAPI, Pandas, DuckDB, and Gemini API for data analysis, REST APIs, natural-language-to-SQL queries, and automated business insights.



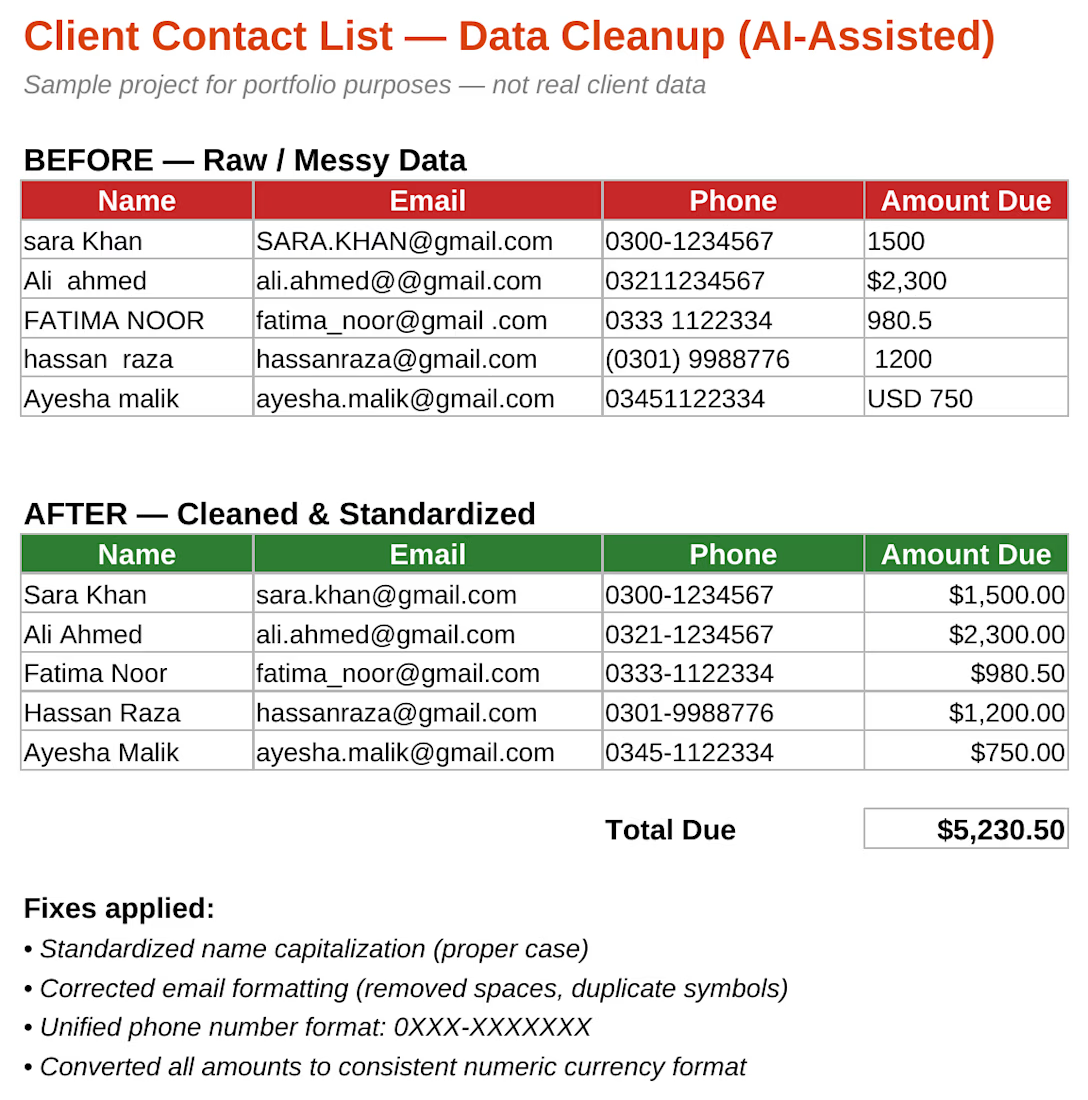
AI-Assisted Data Cleaning & Formatting for Client Contact Lists | Excel Expert
Cleaned and standardized a messy client contact database using Excel and AI tools — fixing inconsistent name formatting, broken email entries, mismatched phone number formats, and irregular currency values. Delivered accurate, standardized, ready-to-use data with zero errors. Ideal for businesses needing reliable data entry, CRM cleanup, or bookkeeping support.
#DataCleaning #ExcelExpert #DataEntry #Bookkeeping #AItools #DataAnalysis #VirtualAssistant #SmallBusinessSupport #FreelanceAccountant #ExcelSpreadsheet