The network for creativity
Join 1.25M professional creatives like you
Connect with clients, get discovered, and run your business 100% commission-free
Creatives on Contra have earned over $150M and we are just getting started
Back to feedPost

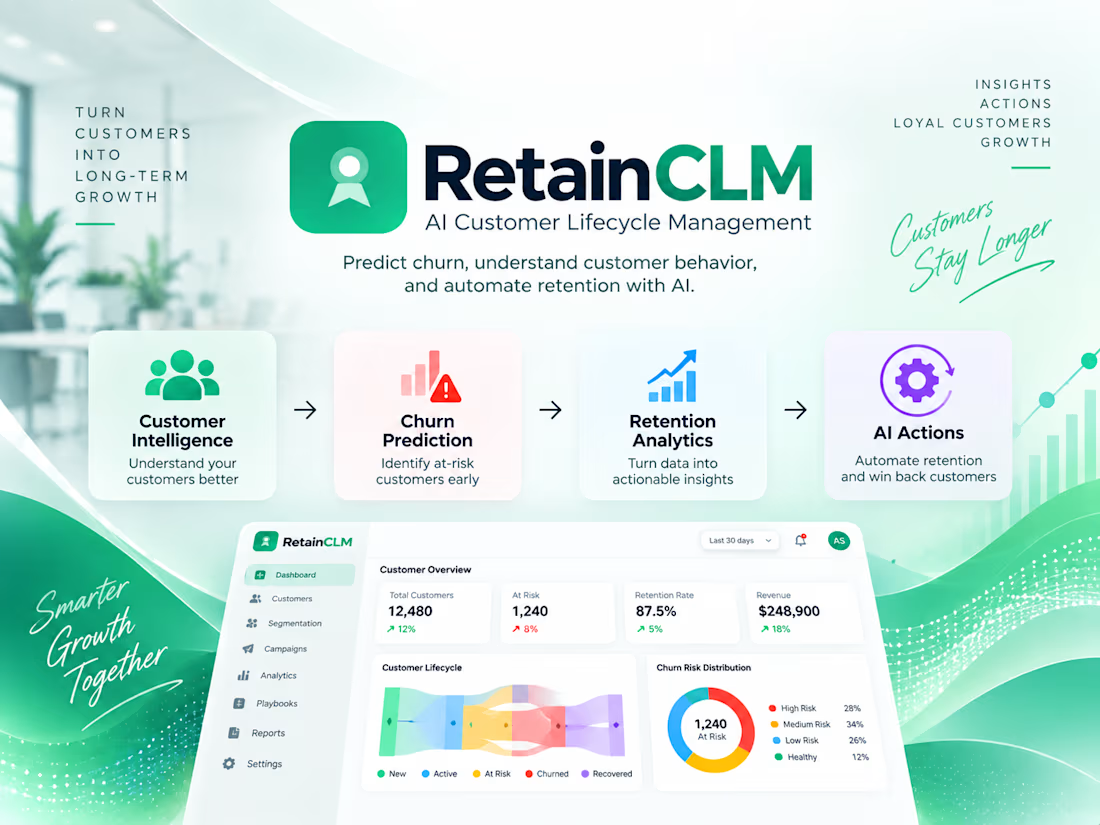
RetainCLM - AI Customer Lifecycle Management
Predict churn, understand customer behavior, and automate retention with AI.
Project description
RetainCLM is an AI-powered Customer Lifecycle Management platform designed to help businesses understand customer behavior, predict churn, and take action before customers leave.
I designed the product around the complete customer lifecycle, combining customer intelligence, machine-learning-driven churn prediction, segmentation, retention analytics, and automated retention workflows in one connected platform.
The system transforms customer data into actionable intelligence, helping teams identify at-risk customers, understand lifecycle movement, automate retention actions, and make more informed decisions around customer growth and recurring revenue.


The network for creativity
Join 1.25M professional creatives like you
Connect with clients, get discovered, and run your business 100% commission-free
Creatives on Contra have earned over $150M and we are just getting started
Challenges
View all


Related posts

🚀 Just Built an AI Lead Nurturing Agent for B2B Sales Teams!
The problem: Most B2B companies lose leads because follow-ups are slow. By the time a rep reaches out, the lead has already talked to competitors.
The solution: An AI agent that handles the entire lead nurturing workflow:
✅ Scores leads as HOT/WARM/COLD automatically
✅ Sends personalized follow-ups within 60 seconds
✅ Logs everything to Google Sheets/CRM
✅ Alerts reps only for serious buyers
✅ Books meetings directly into calendars
Tech Stack: n8n | OpenAI | Google Sheets | Gmail | Telegram
Result: 60% higher conversion rate, 15+ hours/week saved per rep.
This is like having an AI SDR that never sleeps — for $300/month.
Want this for your sales team? Let's talk.
#AIAutomation #LeadNurturing #B2BSales #SalesOps #n8n #PropTech


The bit about auto booking meetings into calendars looks like it will eliminate a lot of scheduling back and forth.

👋 I am new to Contra and I did my first post without realizing I hadn't even introduced myself!
Hey! I am Abuzar.
I build AI agents, automations and full web apps for small businesses and freelancers:
🤖 Agents that reply to new leads and follow up so nobody goes cold
💬 Chatbots that answer customers using your own documents
🔗 Connections between your apps, so data moves on its own instead of through copy-paste
💻 Custom web apps and dashboards, from idea to launch, when off-the-shelf tools just dont fit
✦ ✦ ✦✦ ✦ ✦✦ ✦ ✦✦ ✦ ✦✦ ✦ ✦✦ ✦ ✦
For 3.5 years I built payment systems at a fintech company, where my whole job was making sure money never disappeared.
Now I make busywork disappear instead 😄
Off the keyboard, you will find me watching cricket or on a long motorcycle ride somewhere outside Lahore 🏏🏍️
I've noticed this community is full of amazing designers, editors and creatives, and I'm the guy who loves the techy plumbing behind the scenes. So I'm curious 👇
What's the most annoying non-creative part of your freelance week? Invoicing, client onboarding, chasing feedback, organising files?
Tell me in the comments. I'll reply to each one with an idea for how to automate it 🤝

hopify-style store dashboard, AI workflow connections, product cards and automation icons


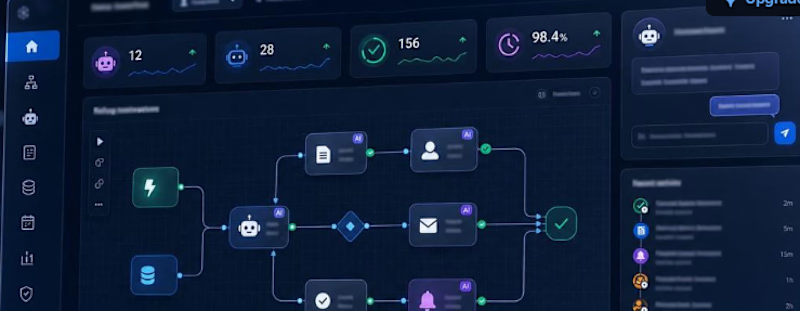

Nice concept. Connecting store data with AI workflows can make e-commerce operations much more efficient.