The network for creativity
Join 1.25M professional creatives like you
Connect with clients, get discovered, and run your business 100% commission-free
Creatives on Contra have earned over $150M and we are just getting started
Back to feedPost
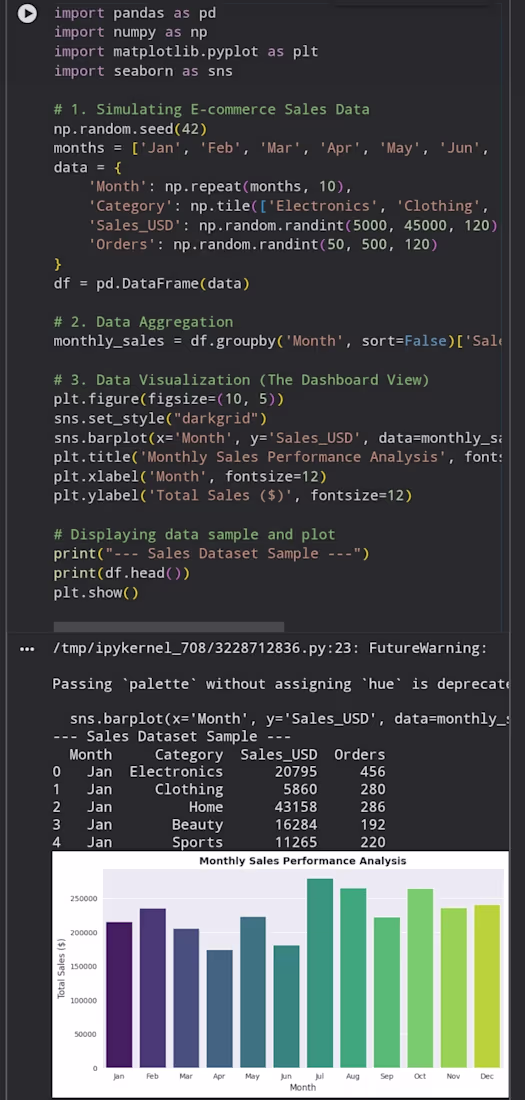
E-Commerce Sales Data Analysis & Dashboard
Objective: Built a data visualization dashboard to analyze e-commerce sales performance and customer purchasing trends across various product categories.
Data Processing: Simulated and aggregated a retail dataset using Pandas, tracking monthly sales volumes, order frequencies, and total revenue.
Insights & Visualization: Designed clean data visualizations using Matplotlib and Seaborn to highlight seasonal sales trends and top-performing categories.
Tech Stack: Python, Pandas, NumPy, Matplotlib, Seaborn.
The network for creativity
Join 1.25M professional creatives like you
Connect with clients, get discovered, and run your business 100% commission-free
Creatives on Contra have earned over $150M and we are just getting started
Related posts
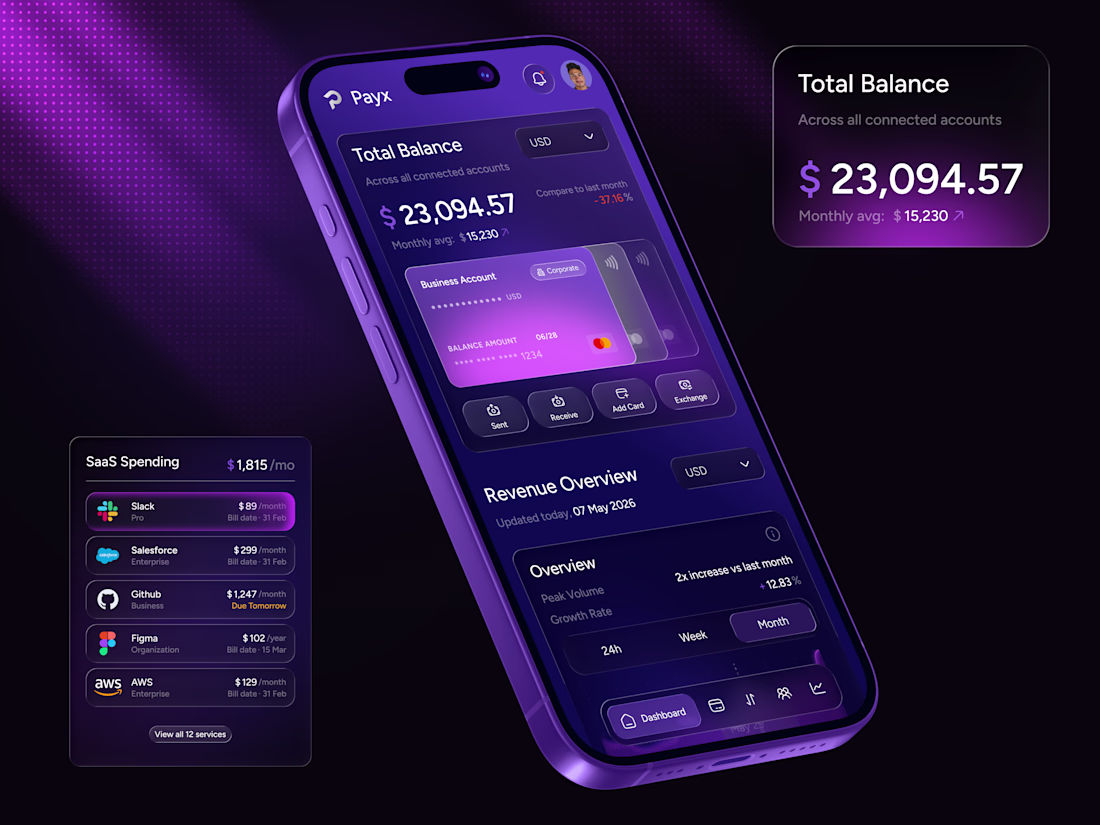
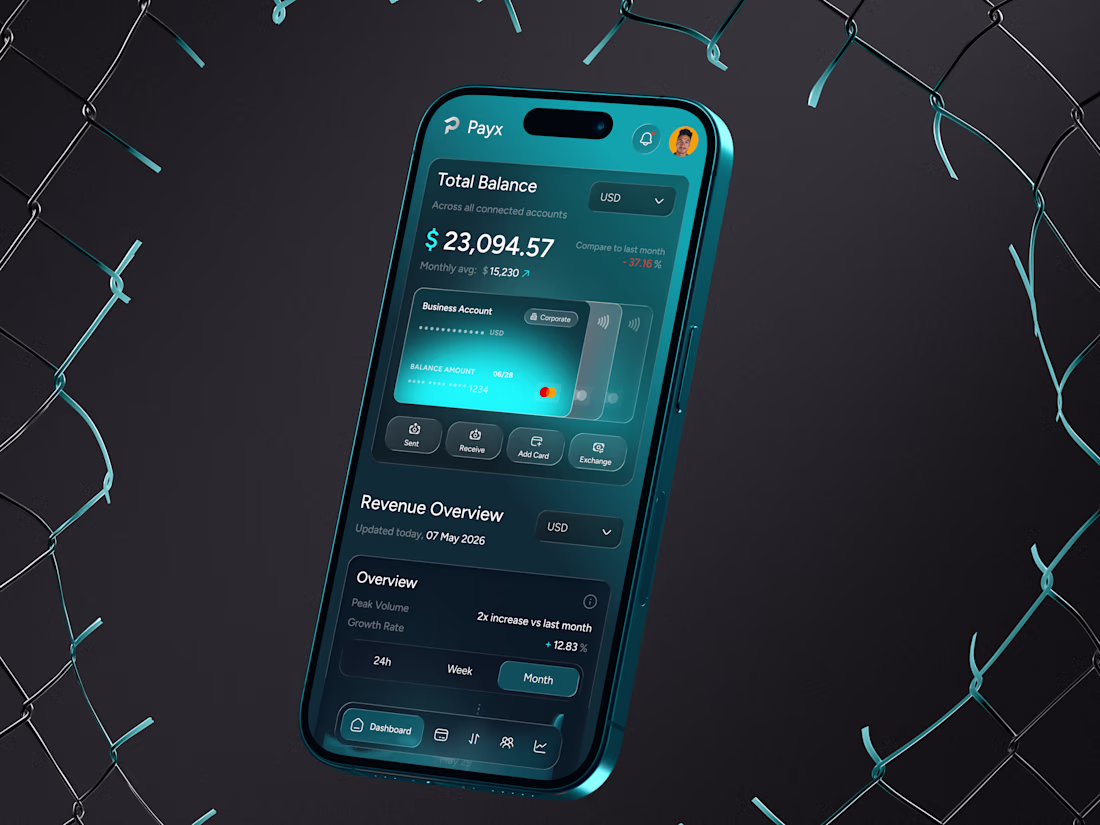
Payx — finance dashboard for business 💜
Designed a SaaS fintech product for tracking balance, transactions, SaaS spending and revenue overview — all in one place.
Dark UI, two color themes, desktop + mobile 📱🖥️
Sometimes the best UX decision is just getting out of the user's way and letting the data speak 🤙


Damn, that's clean. The hierarchy works really well.
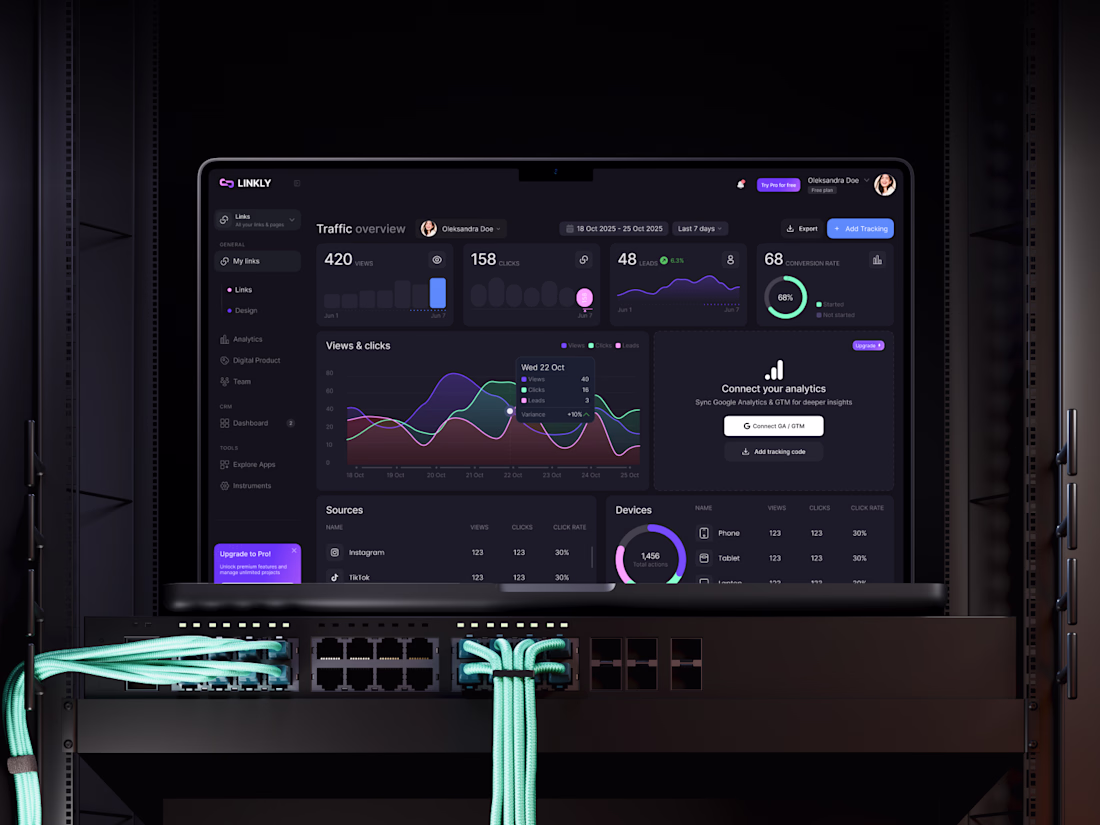
Linkly — SaaS Analytics Dashboard
UI design for a link-in-bio platform with built-in CRM and traffic analytics. Focused on making data-heavy information feel clean and actionable — dark mode, clear hierarchy, zero clutter.
Role: UI/UX Design · Design System · Figma

Linkly — SaaS Analytics Dashboard
UI design for a link-in-bio platform with built-in CRM and traffic analytics. Focused on making data-heavy information feel clean and actionable — dark mode, clear hierarchy, zero clutter.
Role: UI/UX Design · Design System · Figma
Trending
Claude
Claude has entered the design space. How are you using Claude Design?
Contra University
Learn from expert creatives how to earn more using next-gen AI tools.
MagicPath
The canvas is infinite, and exploration is becoming the workflow. How are you using MagicPath?
creativeaiflow
Creative AI workflows are evolving. What tools do you use, and what are their strengths and weaknesses?
freelancerlife
Freelancer life is wins, pivots, and everything in between. What’s yours right now?