The network for creativity
Join 1.25M professional creatives like you
Connect with clients, get discovered, and run your business 100% commission-free
Creatives on Contra have earned over $150M and we are just getting started
Back to feedPost

Pokémon Data Analytics Dashboard
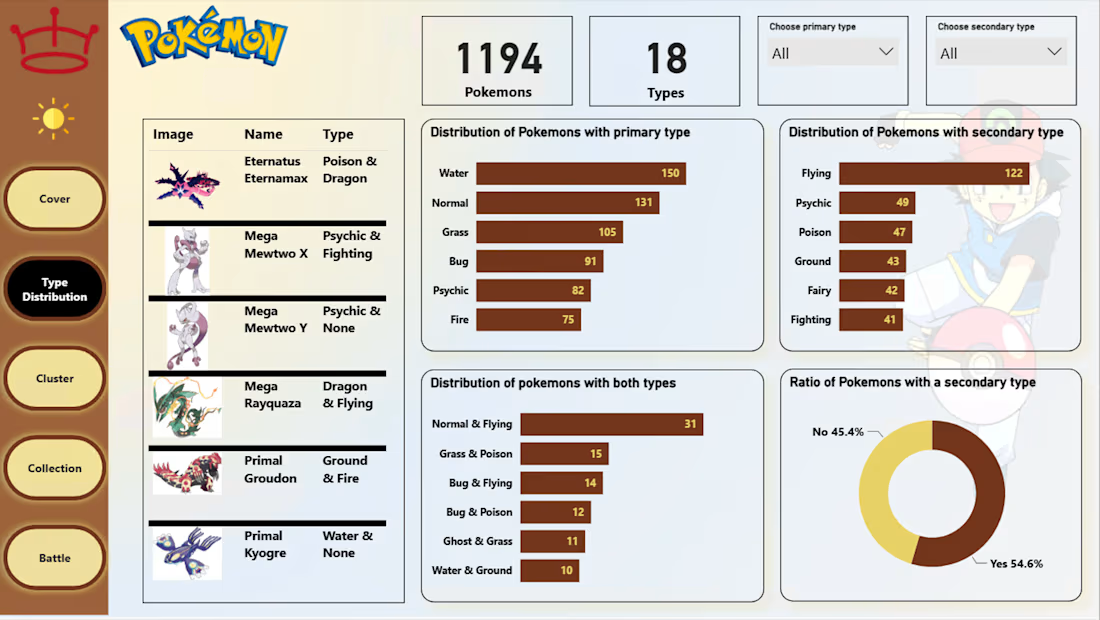
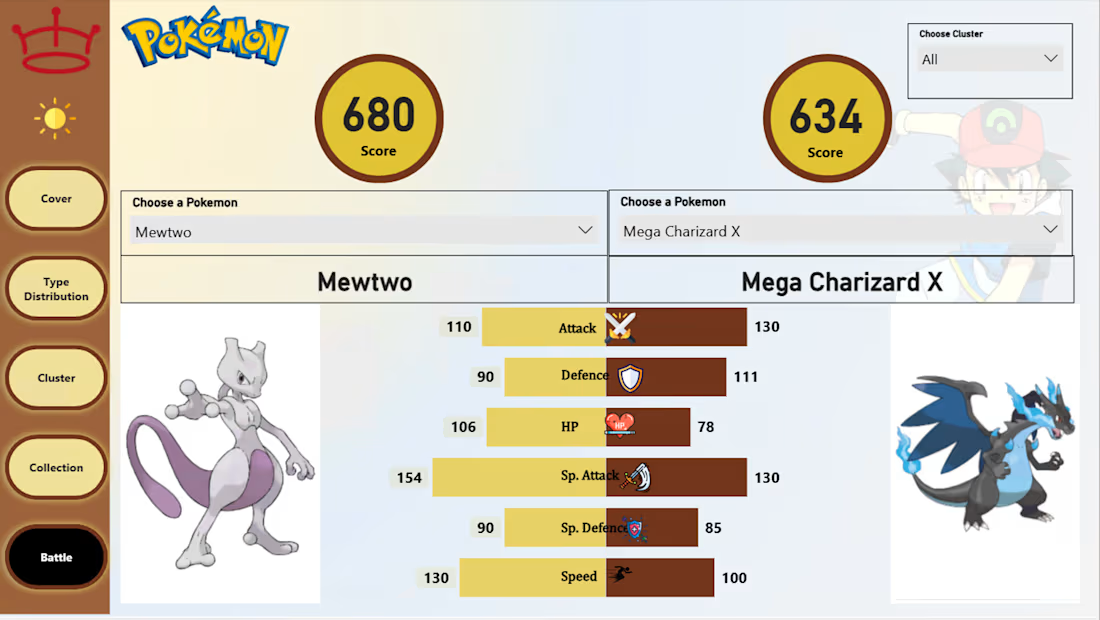
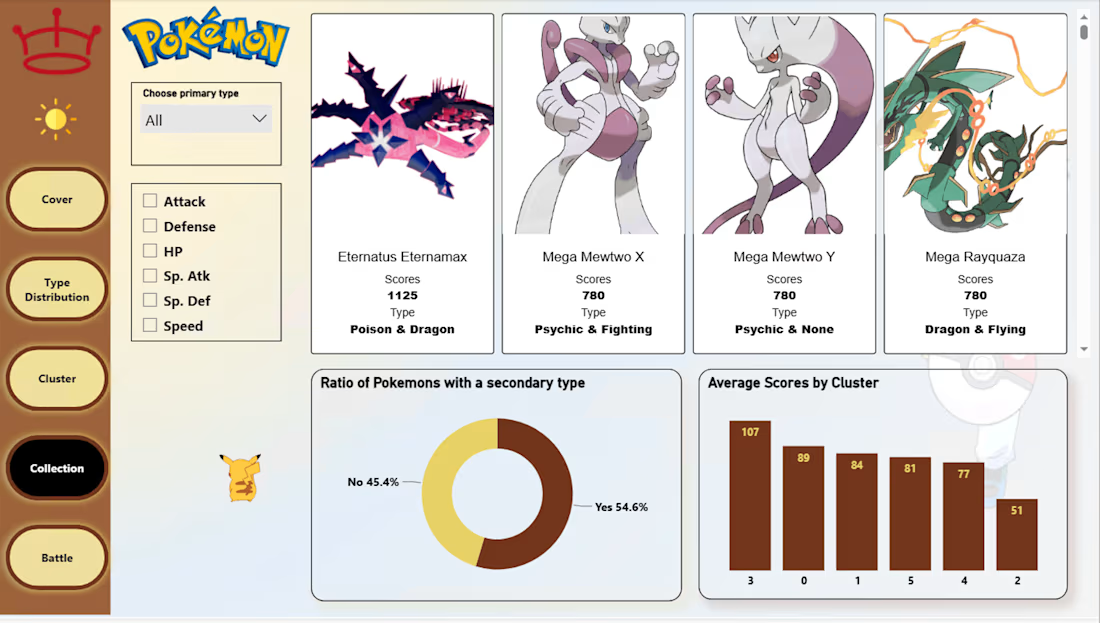
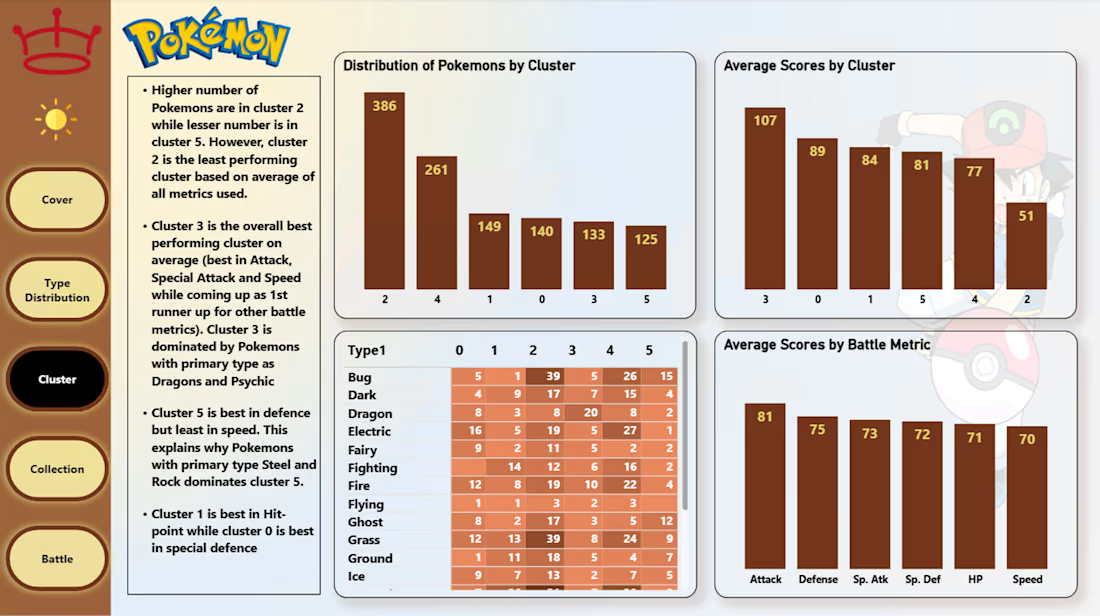
An end-to-end data storytelling project was built, analyzing Pokémon across types through Python-based machine learning and an interactive Power BI dashboard covering type distribution, stat clustering, and battle matchups.
Raw data was cleaned and engineered. K-Means Clustering was used to segment Pokémon by battle stats, revealing distinct performance groups dominated by specific types. Findings were presented across a 4-page interactive dashboard (Type Distribution, Cluster, Collection, Battle) .
Tools: Python (Pandas, NumPy, scikit-learn, Regex), Power BI


The network for creativity
Join 1.25M professional creatives like you
Connect with clients, get discovered, and run your business 100% commission-free
Creatives on Contra have earned over $150M and we are just getting started
Trending
retrofuturism
Share your favorite designs from the past exploring the distant future. Or your own take on the aesthetic 🚀
halftone
Dots. Texture. Grain. Let's see your designs using the halftone technique.

Midjourney
Creatives are showing off what they're making with Midjourney.
colorgrade
Video editors sound off: How do you enhance the mood of your video in color grading?


Related posts

🚀 Full Stack Poker Bot Developer | Multi-Table Automation | AI Poker Bot | Frontend & Backend Expert
🎯 Turn Your Poker Automation Idea Into a High-Performance Bot
Looking for a developer who can build a professional poker bot, multi-table automation system, or custom desktop/web application from the ground up?
You're looking at one of my previous projects—a fully functional multi-table poker bot built as a complete full-stack solution. From the user interface to the backend logic, automation engine, and performance optimization, every component was designed and developed by me.
Whether you need a poker automation tool, AI-powered poker assistant, bot management dashboard, or a scalable backend system, I can help transform your idea into production-ready software.
🎥 Previous Project
Multi-Table Poker Bot
✅ Simultaneous multi-table support
✅ Real-time game state detection
✅ Automated decision engine
✅ Fast action execution
✅ Modern responsive interface
✅ Stable backend architecture
✅ Performance optimized
✅ Built for speed and reliability
Note: This video showcases a previous project demonstrating my software engineering and automation capabilities.
💻 My Expertise Includes
♠ Poker Bot Development
Multi-table poker bots
AI-assisted poker automation
Decision engine development
Table detection
OCR integration
Screen recognition
Action automation
Session management
🤖 Automation Development
Desktop automation
Browser automation
Bot development
Workflow automation
Process automation
Data scraping
API integrations
🌐 Full Stack Development
Frontend
React
Next.js
TypeScript
JavaScript
Tailwind CSS
HTML5
CSS3
Backend
Node.js
Express.js
Python
REST APIs
WebSocket
Authentication
Database architecture
🗄 Database
PostgreSQL
MySQL
MongoDB
Redis
⚡ Performance Engineering
High-speed processing
Concurrent task handling
Multi-threaded architecture
Low-latency execution
Scalability optimization
☁ Cloud & Deployment
Docker
VPS deployment
Linux servers
CI/CD
Production deployment
😖 Facing These Problems?
❌ Existing poker bots are slow or unreliable
❌ Multi-table support is unstable
❌ Automation misses actions
❌ Poor UI and user experience
❌ Backend crashes under heavy workloads
❌ Need a custom solution instead of generic software
❌ Looking for a developer who understands both frontend and backend
❌ Need ongoing maintenance and feature upgrades
⭐ Why Work With Me?
✔ Full Stack Developer (Frontend + Backend)
✔ End-to-end development—from concept to deployment
✔ Clean, scalable, and maintainable code
✔ Strong focus on performance and reliability
✔ Experience building complex automation systems
✔ Modern UI/UX with responsive interfaces
✔ API integration expertise
✔ Fast communication and transparent updates
✔ Long-term support and continuous improvements
✔ Custom-built solutions tailored to your workflow
📦 What You'll Get
✅ Complete custom software solution
✅ Responsive and intuitive user interface
✅ Robust backend architecture
✅ High-performance automation engine
✅ Secure database integration
✅ API development and integration
✅ Source code ownership
✅ Deployment assistance
✅ Bug fixes and testing
✅ Documentation
✅ Ongoing support (optional)
🛠 Technologies I Work With
React • Next.js • Node.js • Express.js • TypeScript • JavaScript • Python • Electron • PostgreSQL • MongoDB • MySQL • Redis • Docker • REST API • WebSocket • Git • Linux • Tailwind CSS
🚀 Let's Build Something Exceptional
If you need a Full Stack Developer, Automation Engineer, or Custom Software Developer who can deliver scalable, high-performance solutions, I'd be happy to discuss your project.
Full Stack Developer, Poker Bot Developer, Multi-Table Poker Bot, Custom Poker Software, Automation Developer, AI Poker Bot, Desktop Application Developer, Web Application Developer, React Developer, Node.js Developer, Python Developer, Backend Developer, Frontend Developer, Custom Bot Development, Process Automation, OCR Integration, WebSocket Development, API Development, Software Engineer, Automation Solutions, Custom Desktop Software, SaaS Development, Performance Optimization, Remote Full Stack Developer, Contra Developer, Custom Business Software.


Awesome!!!!
♠️ Real-Time Poker Analytics Dashboard & Desktop Automation Platform
Overview
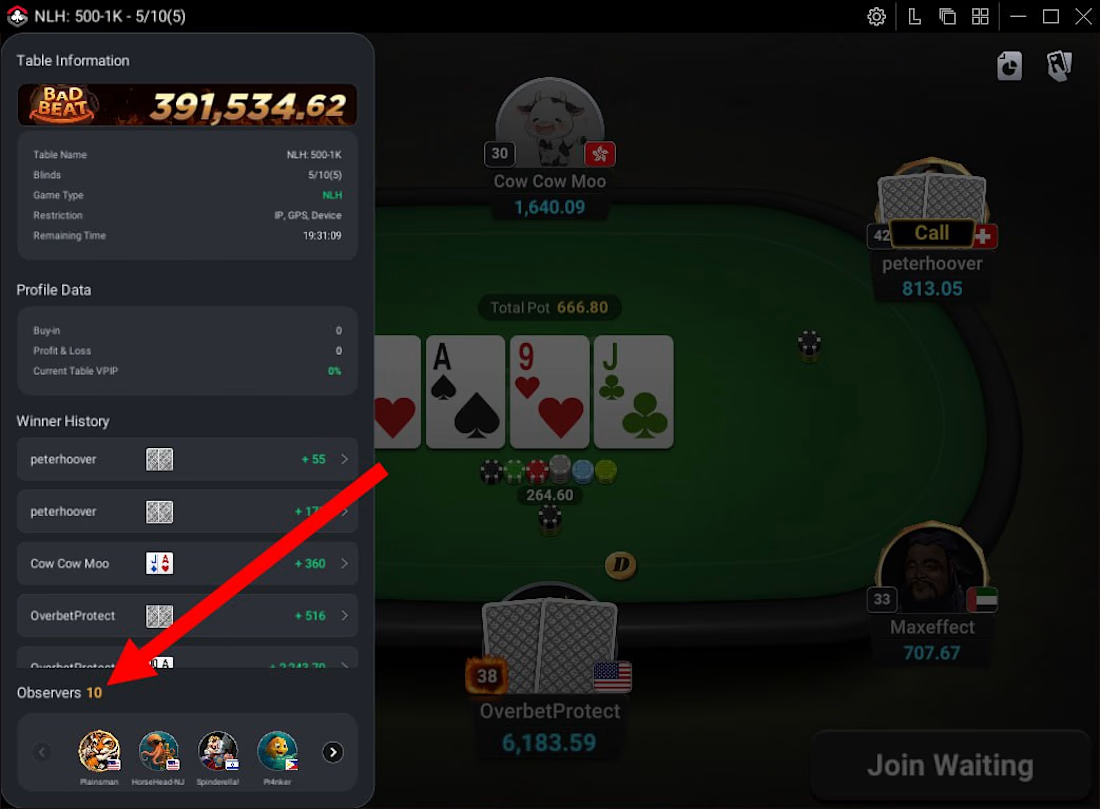
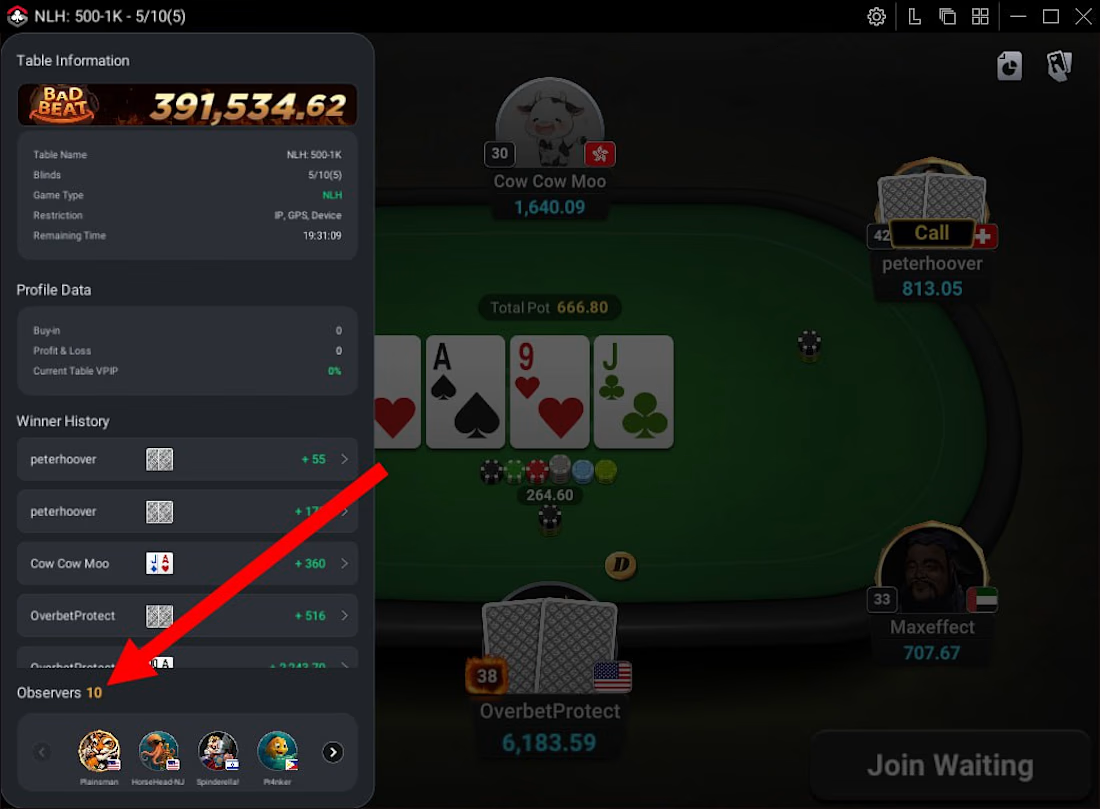
I designed and developed a high-performance desktop application that provides real-time poker table analytics, player tracking, waiting list management, observer detection, game statistics, and intelligent automation for live poker environments.
The platform continuously monitors active tables, collects live game information, tracks player activity, displays historical performance, manages waiting queues, and delivers actionable insights through a modern desktop interface.
Built with scalability and performance in mind, this application combines real-time data processing, desktop software engineering, and intelligent UI automation to deliver a smooth and responsive user experience across multiple poker tables.
Features Delivered
✔️ Real-Time Table Monitoring
✔️ Waiting List Management
✔️ Observer Detection & Tracking
✔️ Player Statistics Dashboard
✔️ Winner History Analytics
✔️ Table Information Panel
✔️ Live Performance Metrics
✔️ Multi-Table Management
✔️ Smart User Interface
✔️ Fast Desktop Performance
✔️ Automated Data Synchronization
✔️ Responsive Cross-Platform Desktop Application
Error Fixes
I can troubleshoot and resolve issues such as:
Waiting list synchronization errors
Observer detection failures
Player statistics inaccuracies
Table recognition issues
Real-time data synchronization bugs
Dashboard rendering problems
Desktop application crashes
High CPU and memory usage
Performance bottlenecks
UI responsiveness issues
Electron application errors
JavaScript runtime exceptions
API communication failures
Data processing inconsistencies
Cross-platform compatibility problems
My Expertise Includes
✅ Electron.js Desktop Applications
✅ ClubGG Software Development
✅ Poker Analytics Systems
✅ Real-Time Data Processing
✅ Live Dashboard Development
✅ Browser & UI Automation
✅ DOM Inspection & Dynamic Element Detection
✅ Waiting Queue Management
✅ Observer Tracking Systems
✅ Performance Optimization
✅ Node.js Backend Development
✅ JavaScript & TypeScript Engineering
✅ Cross-Platform Desktop Software
✅ REST API Integration
✅ Modern UI/UX Development
✅ Clean Software Architecture
Technologies Used
Electron.js
Node.js
JavaScript (ES6+)
HTML5
CSS3
Chromium DevTools
DOM Manipulation
REST APIs
Real-Time Event Processing
Desktop Automation
Performance Optimization
Git & GitHub
Why Work With Me?
I build reliable desktop software that is engineered for speed, accuracy, and long-term maintainability. Every solution is developed with a focus on clean architecture, efficient performance, and an intuitive user experience.
When you hire me, you benefit from:
Production-quality code
Scalable software architecture
Fast and responsive desktop applications
Thorough testing and debugging
Clear communication throughout the project
Reliable post-launch support
Performance-first development
Secure and maintainable implementations
What You'll Get
✔️ Custom desktop application tailored to your workflow
✔️ Real-time analytics dashboard
✔️ Intelligent table monitoring and tracking
✔️ Automated data synchronization
✔️ Responsive and modern user interface
✔️ Optimized application performance
✔️ Clean, well-documented source code
✔️ Scalable architecture for future enhancements
✔️ Cross-platform compatibility
✔️ Ongoing support and maintenance options
Desktop Application Developer • Electron.js Expert • Node.js Developer • JavaScript Engineer • Real-Time Dashboard Development • Analytics Software • Data Visualization • Desktop Automation • UI Automation • Performance Optimization • Custom Software Development • Cross-Platform Desktop Apps • Live Data Processing • Software Architecture • Full-Stack Developer • Real-Time Monitoring Systems • Business Automation • Custom Dashboard Development
♠️ ClubGG Poker Automation Platform | Real-Time Desktop Software & Smart Table Recognition
Overview
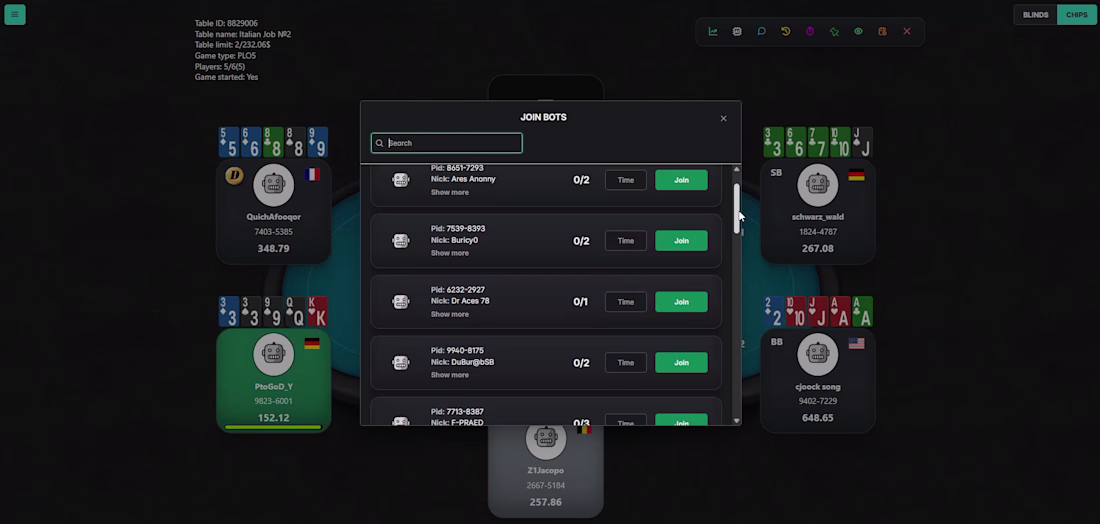
I designed and developed a powerful desktop automation platform for ClubGG Poker, enabling intelligent table recognition, real-time player detection, seat mapping, live chat integration, and automated game interaction.
This project was built from the ground up to provide a seamless experience for users who need fast, reliable, and highly optimized desktop software capable of interacting with live poker environments.
By combining advanced UI automation, desktop engineering, and real-time event handling, I created a scalable system that accurately recognizes active poker tables, detects player positions, synchronizes game data, and provides responsive automation while maintaining excellent performance.
Problems Solved
Many poker automation tools struggle with:
Poor table recognition
Incorrect seat detection
Slow automation response
Unsupported table layouts
Unstable desktop performance
Broken UI after platform updates
Difficult configuration
High CPU and memory usage
Lack of scalability
Poor user experience
This solution was engineered to solve these challenges with a clean, reliable, and high-performance architecture.
My Expertise Includes
✅ ClubGG Desktop Automation
✅ Real-Time Poker Table Recognition
✅ Smart Seat Detection & Mapping
✅ Multi-Table Support
✅ Desktop Software Development
✅ Electron.js Applications
✅ Browser & UI Automation
✅ DOM Inspection & Dynamic Element Detection
✅ Live Game State Synchronization
✅ Chat & Notification Integration
✅ Performance Optimization
✅ Cross-Platform Desktop Applications
✅ Responsive User Interfaces
✅ Scalable Software Architecture
✅ Debugging & Maintenance
Error Fixes
I can diagnose and resolve issues including:
Table recognition failures
Seat positioning bugs
UI rendering problems
Automation logic errors
DOM selector issues
Live update synchronization problems
Performance bottlenecks
High CPU or memory usage
Multi-table detection issues
Electron application bugs
Browser automation failures
JavaScript runtime errors
API integration issues
Desktop application crashes
Compatibility problems after platform updates
Technologies Used
Electron.js
Node.js
JavaScript (ES6+)
HTML5
CSS3
Chromium DevTools
DOM Manipulation
UI Automation
Real-Time Event Processing
Desktop Application Development
Performance Optimization
Git & GitHub
Why Work With Me?
I don't just write code—I build reliable software that is designed for long-term performance, maintainability, and scalability.
When you work with me, you get:
Clean, well-structured code
Fast and responsive applications
Production-ready architecture
Scalable solutions for future growth
Thorough testing and debugging
Clear communication throughout the project
Attention to performance and user experience
Reliable post-delivery support


👊👊👊👊👊👊👊👊