The network for creativity
Join 1.25M professional creatives like you
Connect with clients, get discovered, and run your business 100% commission-free
Creatives on Contra have earned over $150M and we are just getting started
Back to feedPost

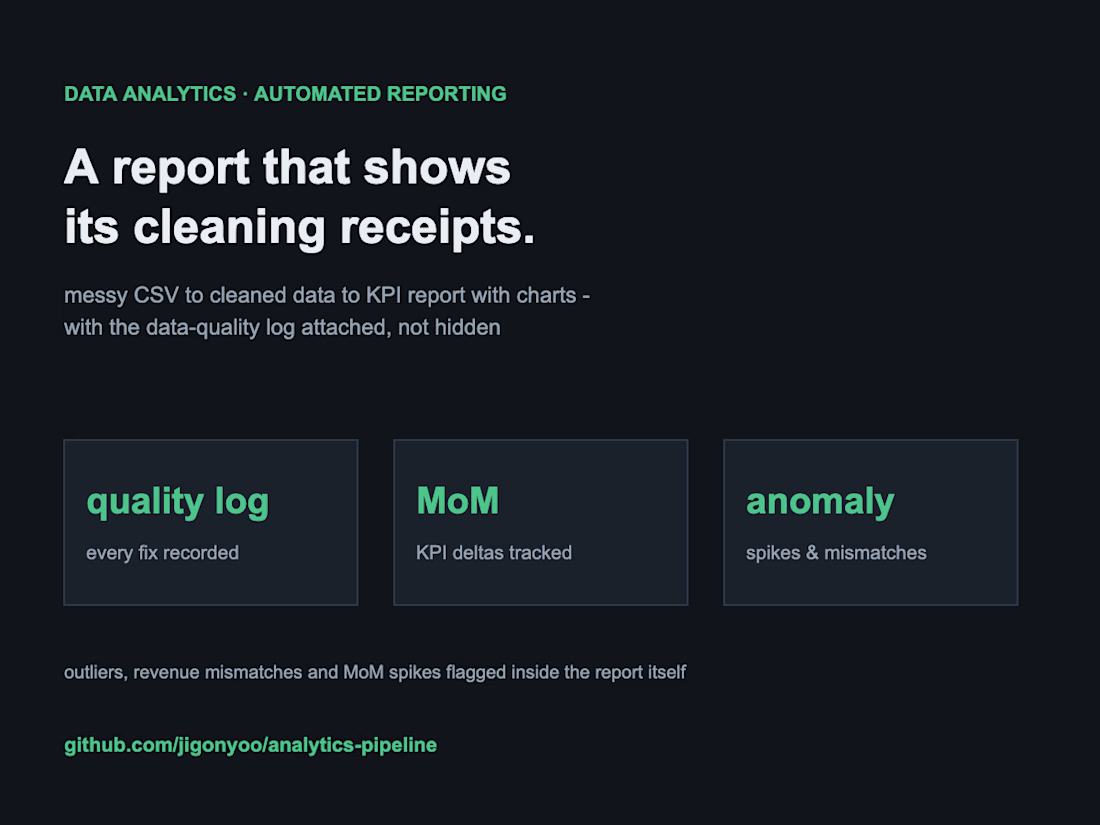
Messy sales CSV in, decision-ready report out: cleaning with a data-quality log, KPIs with month-over-month analysis, and an automated report with charts. Anomaly detection is baked into the report - outliers, revenue mismatches and MoM spikes are flagged where they happen, so it is not a pretty-but-blind dashboard. Every cleaning step is logged, so you can see exactly what was fixed, dropped, or flagged before any number reached a chart. Public code: github.com/jigonyoo/analytics-pipeline

The network for creativity
Join 1.25M professional creatives like you
Connect with clients, get discovered, and run your business 100% commission-free
Creatives on Contra have earned over $150M and we are just getting started





Related posts

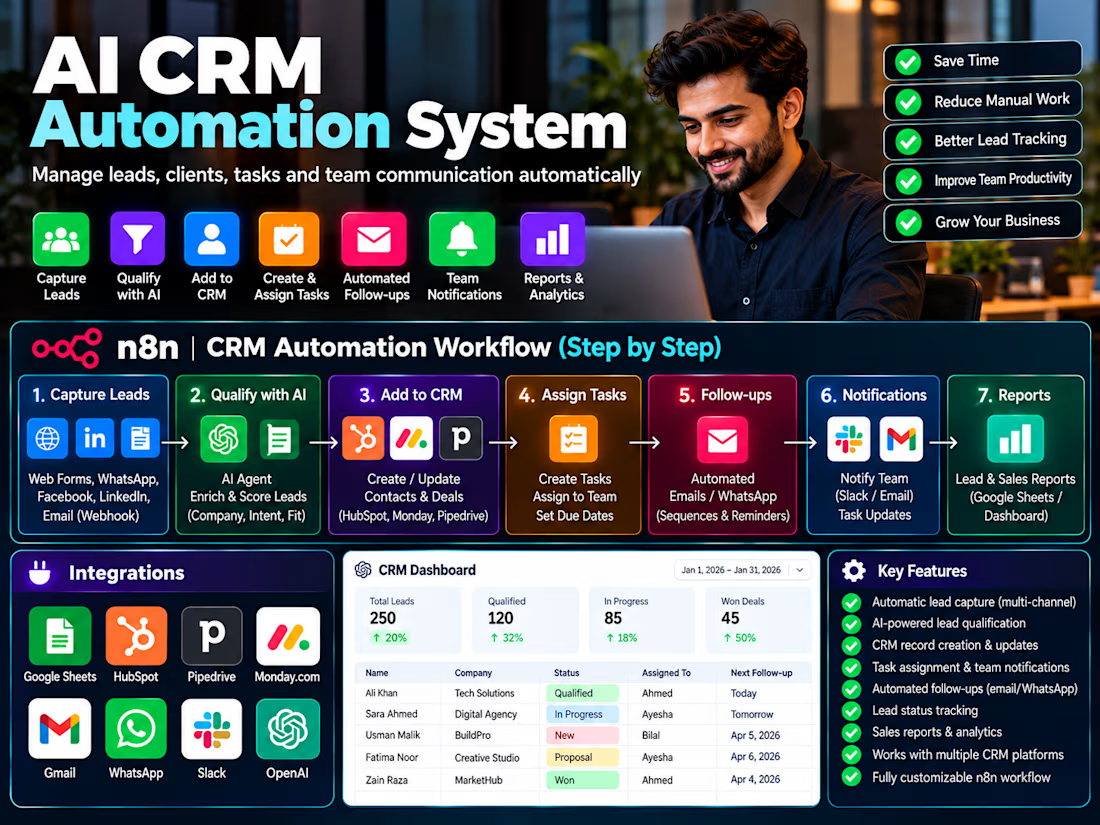
Built an n8n CRM automation system that captures leads, creates and updates CRM records, assigns tasks, sends team notifications, automates follow-ups and generates reports.



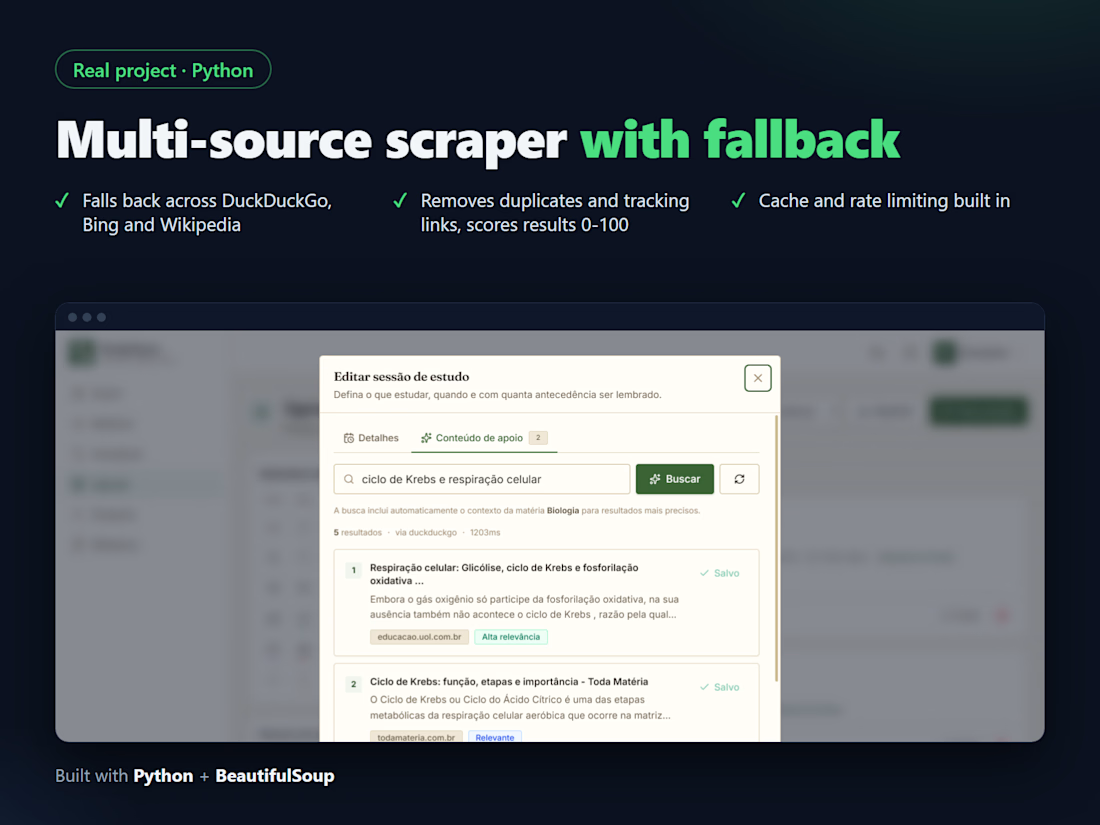
Multi-source web scraper with fallback


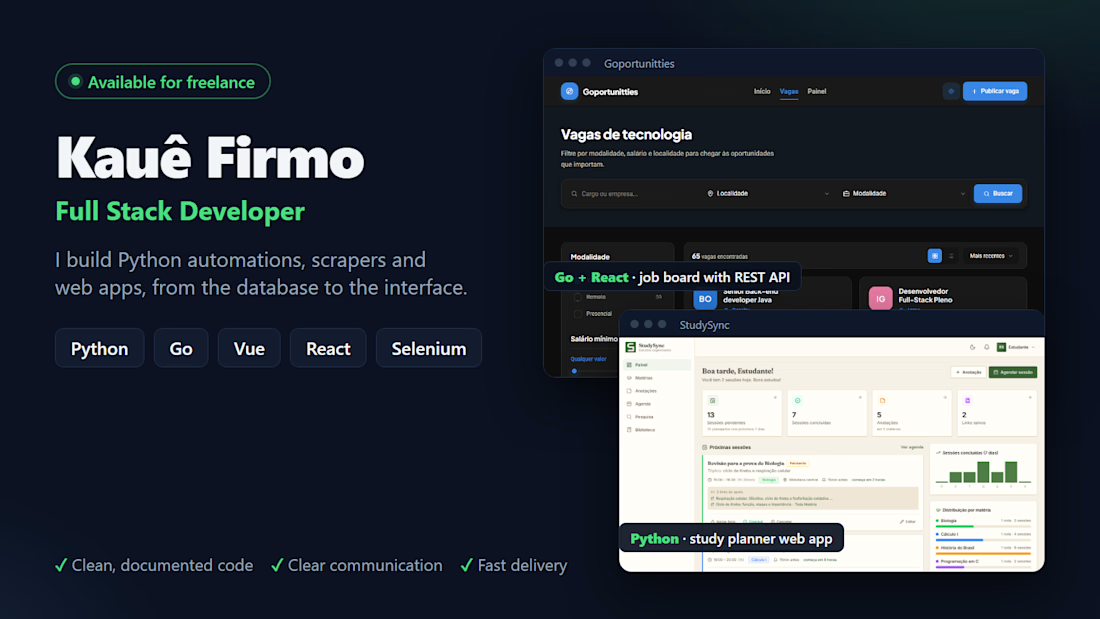
Hi, I'm Kauê, a full stack developer from Brazil 👋
I build Python automations, web scrapers and complete web apps: REST APIs in Go and Python with React or Vue on the front end.
If you have a task someone on your team does by hand every week, there's a good chance a script can do it in minutes.
Open for new projects. Send me a message with what you need!

Great