The network for creativity
Join 1.25M professional creatives like you
Connect with clients, get discovered, and run your business 100% commission-free
Creatives on Contra have earned over $150M and we are just getting started
Back to feedPost

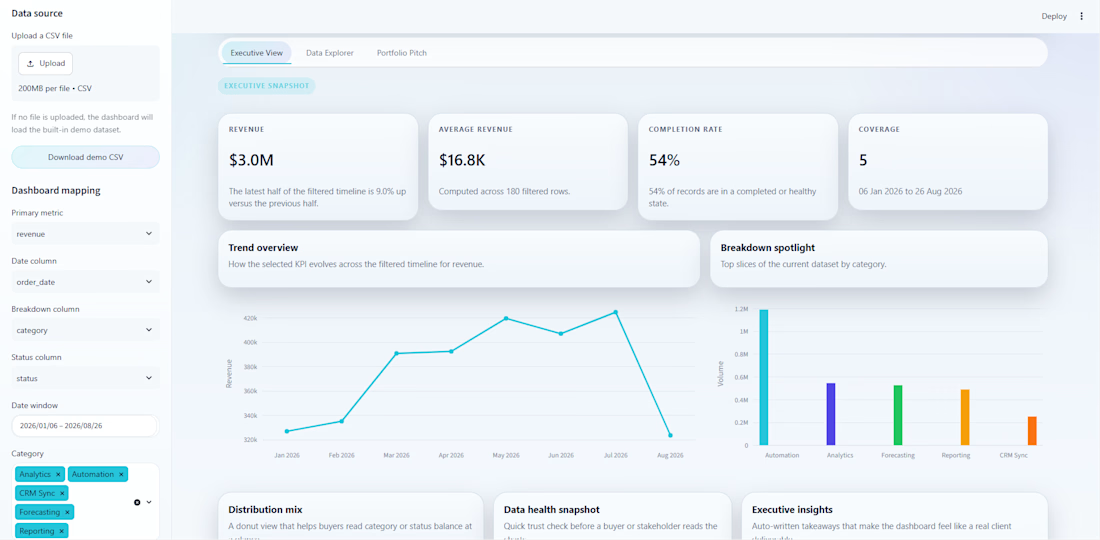
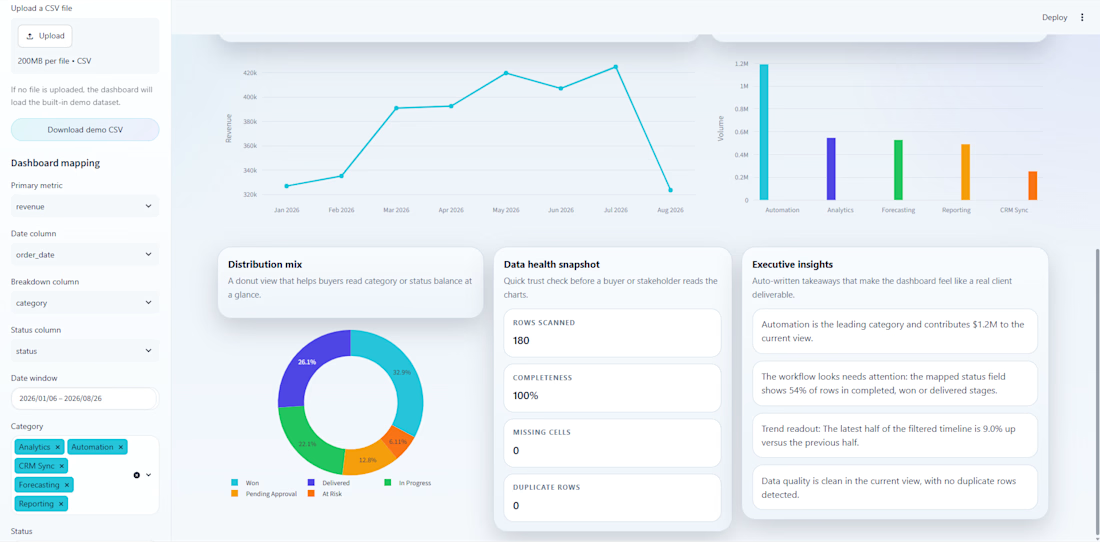
I developed an executive dashboard in Python with Streamlit to transform CSV files into interactive visual reports. The application automatically detects date, metric, and category columns, then generates KPIs, charts, filters, and auto-written insights. It also highlights data quality issues such as missing values and duplicates. The goal of the project is to make data analysis and decision-making faster, simpler, and more visual.


The network for creativity
Join 1.25M professional creatives like you
Connect with clients, get discovered, and run your business 100% commission-free
Creatives on Contra have earned over $150M and we are just getting started
Related posts

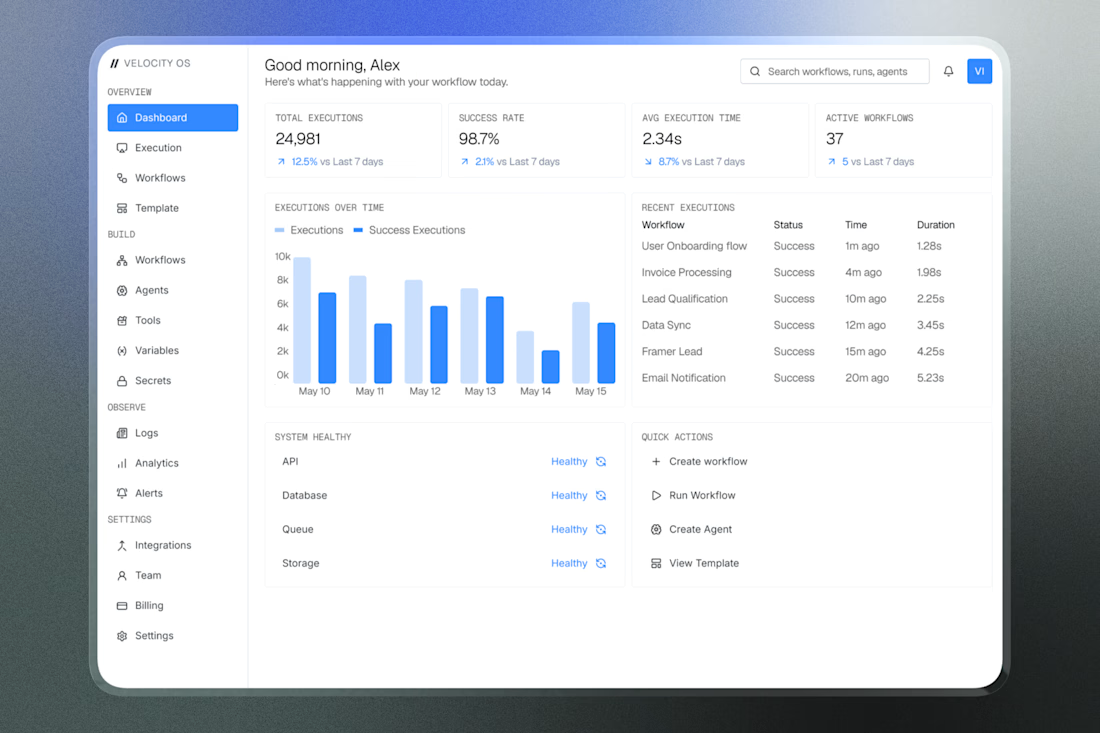
Every metric has a purpose. Designed this dashboard for VelocityAI to make workflow monitoring simple and fast⚡
Here's a preview :)






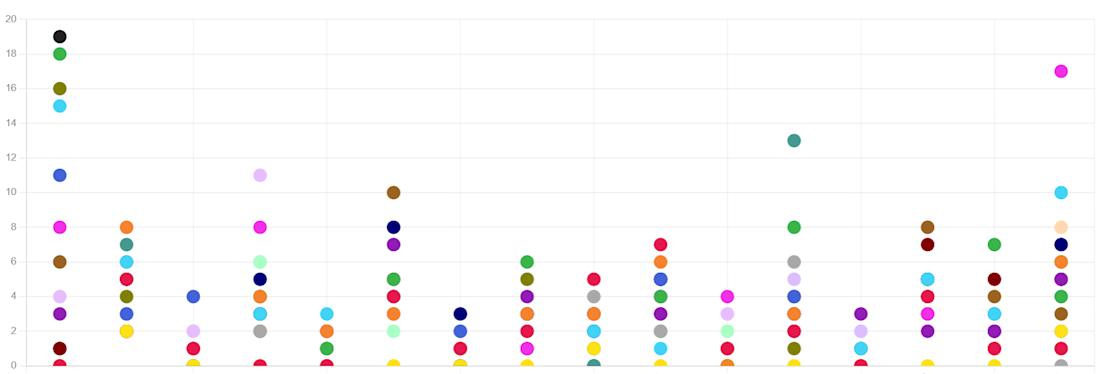
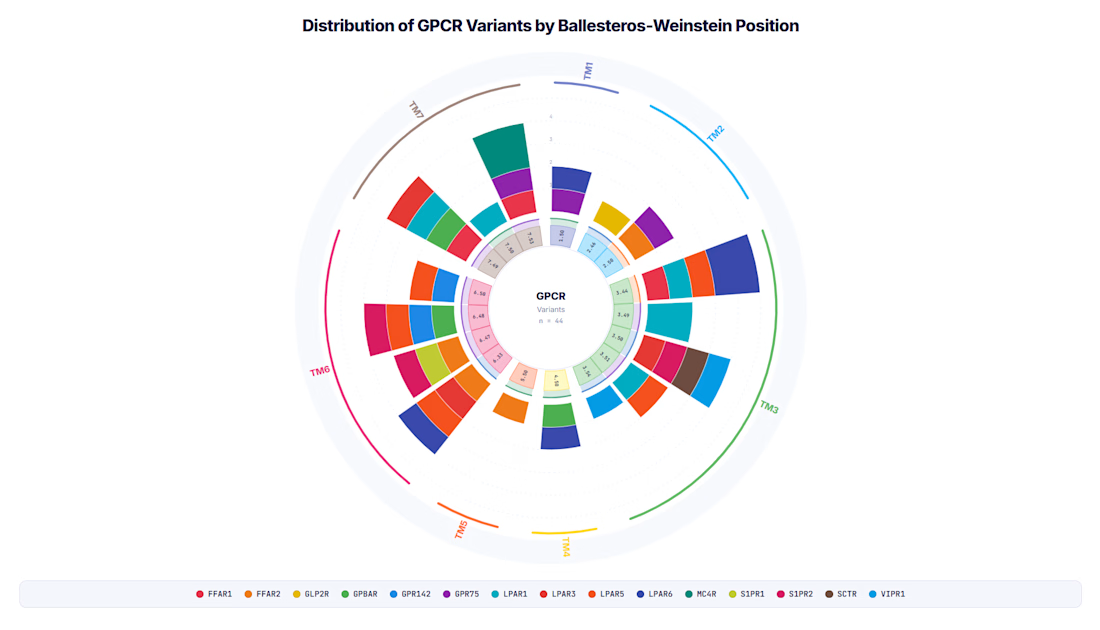
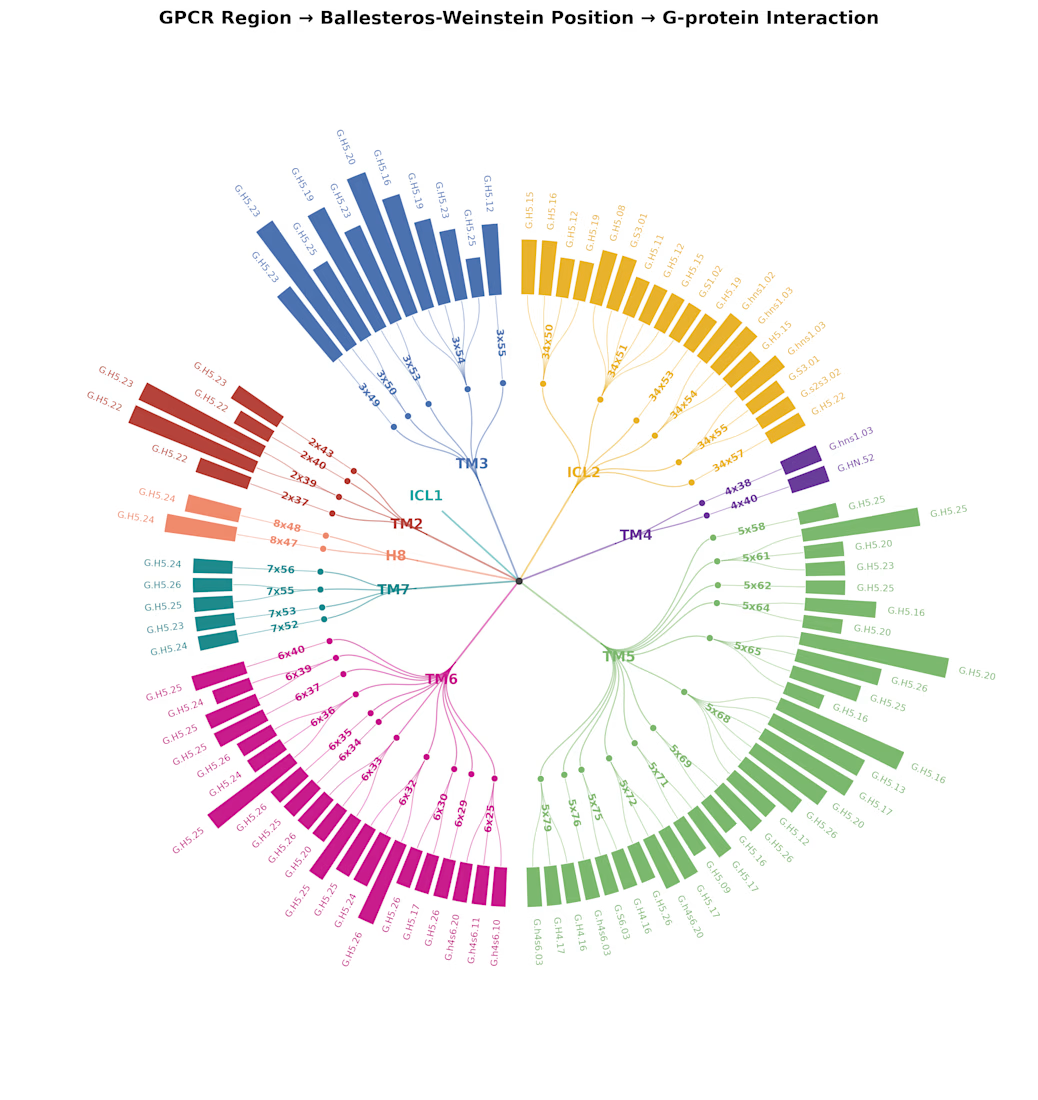

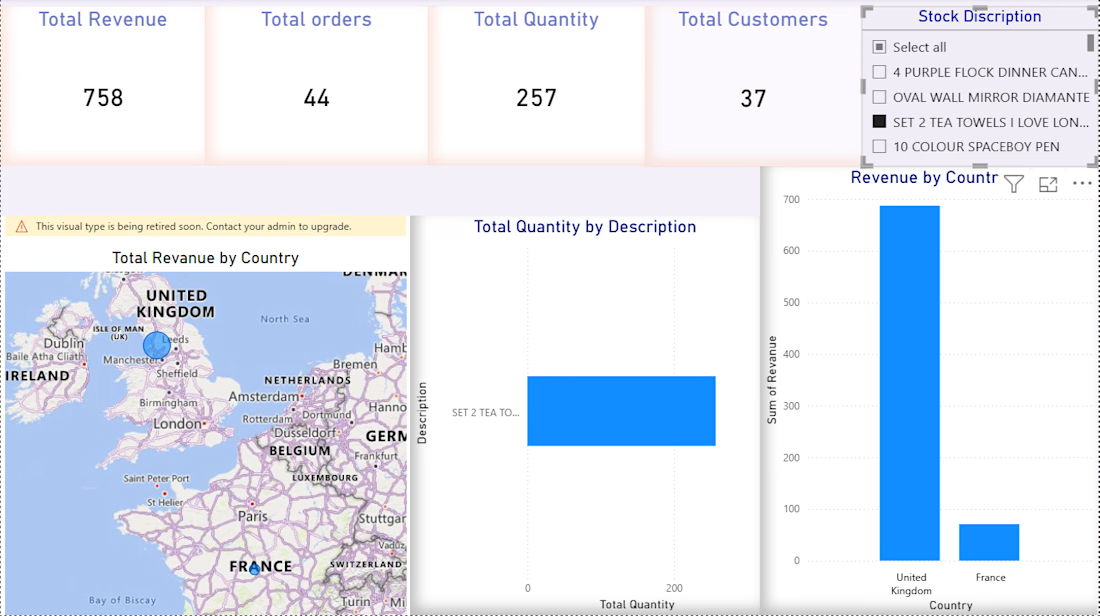
Great visualization! Which library or tool did you use to create this?
Financial Trend Analysis & Customer Churn Dashboard


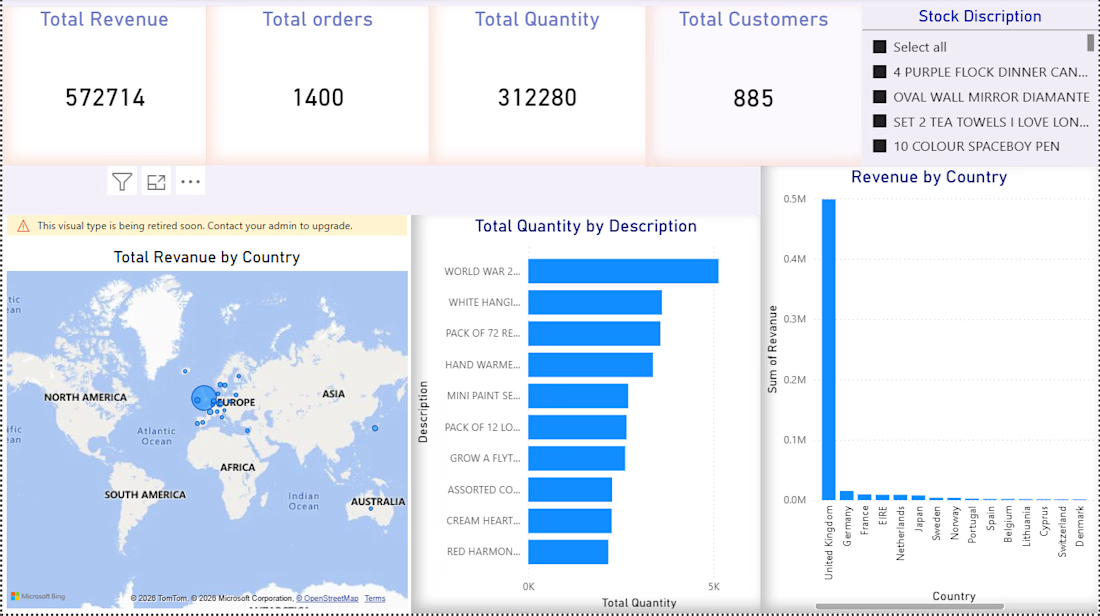













Trending

Claude
Claude has entered the design space. How are you using Claude Design?

Contra University
Learn from expert creatives how to earn more using next-gen AI tools.
creativeaiflow
Creative AI workflows are evolving. What tools do you use, and what are their strengths and weaknesses?
freelancerlife
Freelancer life is wins, pivots, and everything in between. What’s yours right now?