The network for creativity
Join 1.25M professional creatives like you
Connect with clients, get discovered, and run your business 100% commission-free
Creatives on Contra have earned over $150M and we are just getting started
Back to feedPost

Retail Inventory and Sales Analysis
Retailers collect plenty of sales and inventory data, but turning it into useful decisions about stock, demand, and revenue isn't always straightforward. I built this project to bring those numbers together in one interactive Power BI dashboard.
I used Python and Pandas to clean and prepare the data, handling missing values according to their business meaning, then used MySQL to analyze sales, inventory, discounts, product categories, regions, and seasonal trends.
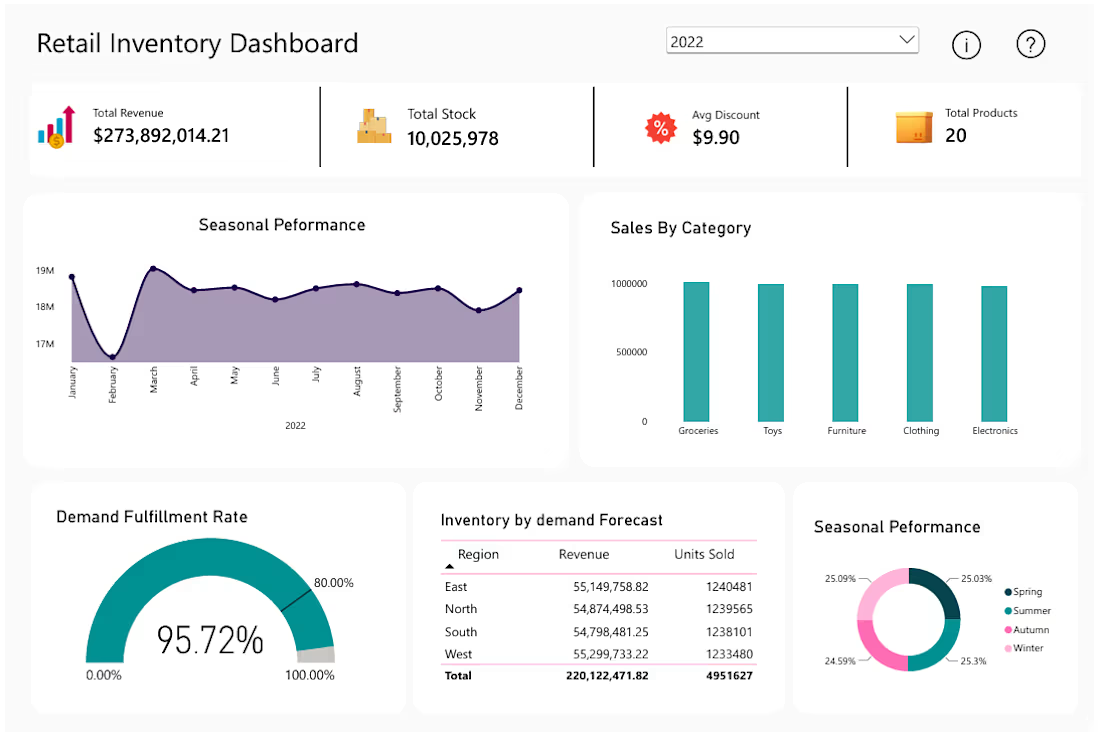
The dashboard brings together key metrics such as revenue, total stock, demand fulfillment, number of products, and average discount. It also shows sales by category, monthly trends, regional performance, inventory against demand forecasts, and seasonal patterns.
One of the key findings was a 95.72% demand fulfillment rate. The analysis also showed relatively balanced sales across the five product categories and similar performance across the four seasons. These insights help highlight sales trends and areas where inventory and demand may need closer attention.
The screenshot shows the dashboard overview, with the complete project available on GitHub.


The network for creativity
Join 1.25M professional creatives like you
Connect with clients, get discovered, and run your business 100% commission-free
Creatives on Contra have earned over $150M and we are just getting started
Related posts

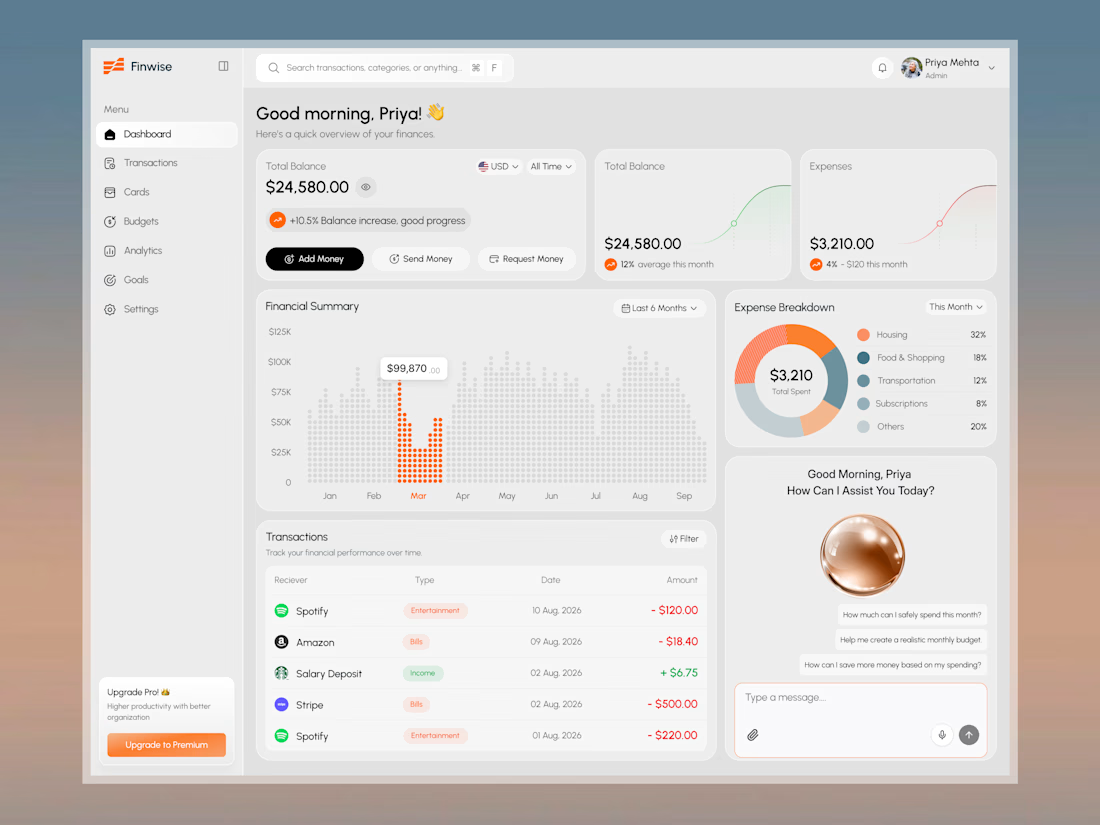
Finwise: Smart Money Dashboard with AI Assistant


this is amazing . love the visual

I wanted to see how far I could take an idea using AI, so I built something.
Meet Instant CSV Dashboard 🚀
It's an experiment in making data easier to explore by turning CSV files into interactive dashboards.
I built it using AI tools, moving beyond static designs to create something people can actually try.
I'm sharing a short demo of the experience, and I'd love to hear what you think.
Have a look: https://interactive-csv-dashboards.ai.studio/
If you work with data regularly, what would you want a tool like this to do for you?
#ProductDesign #AI #DataVisualization
@Google USA


Nice one. I'd want it to pick the right chart for each column on its own. That's where most people get stuck.

For BrewMetrics, an analytics platform for cafés and coffee shops, handled both the design and the development.
The goal was to make data feel friendly and easy to understand for café owners. We went with a warm coffee-inspired palette, clear typography and simple visuals that explain the product at a glance.
Then built it, so the final site looks exactly like the design. No lost details between Figma and launch.
What do you think of the result?
Need someone to design and build your website? My DMs are open ✨

Looks great!