The network for creativity
Join 1.25M professional creatives like you
Connect with clients, get discovered, and run your business 100% commission-free
Creatives on Contra have earned over $150M and we are just getting started
Back to feedPost

Crystal Reports | Sales Projection & Trend Analysis (SAP B1 HANA)
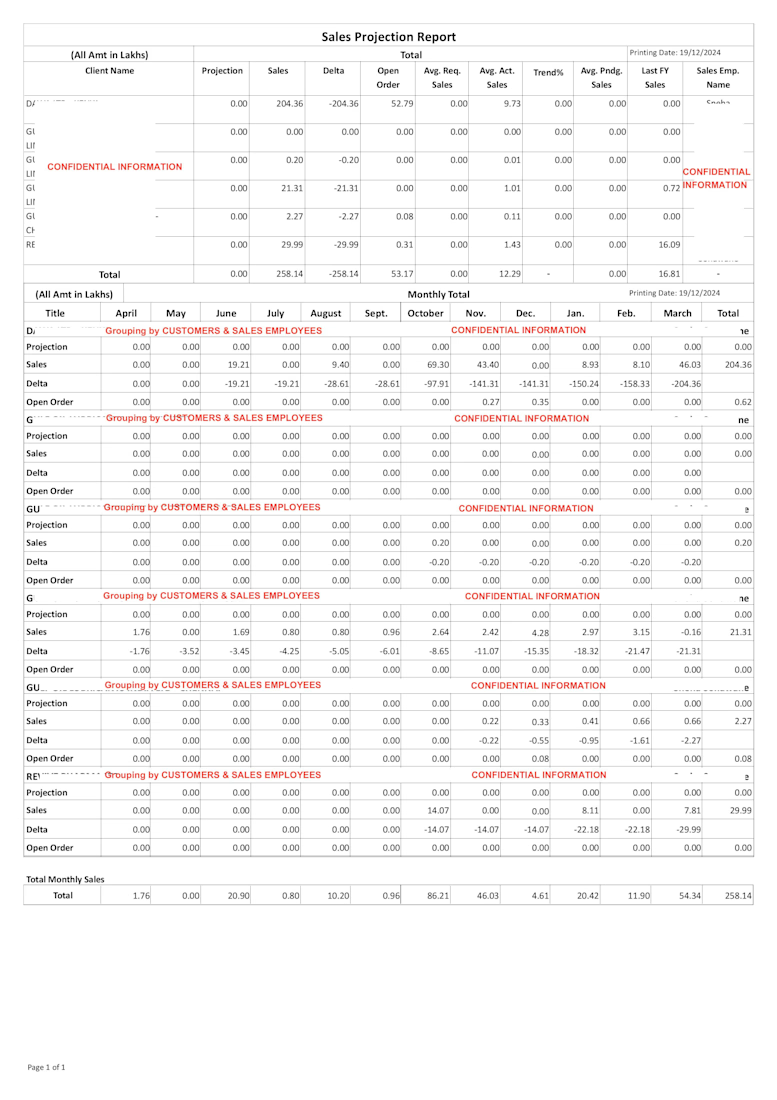
Developed a Sales Projection Report in Crystal Reports on SAP Business One HANA, giving sales and management teams a single view of projected vs. actual sales, performance trends, and open orders - broken down by customer, sales employee, and month, with a full-year rollup.
The report combines two linked views: a client-wise summary (projection, actual sales, delta, open order value, average required vs. actual sales, trend %, pending sales average, and last-FY sales for comparison) and a month-wise breakdown per customer group (Projection, Sales, Delta, and Open Order tracked April through March, with running totals).
Crystal Reports techniques applied:
Grouping sections :data grouped by Customer and Sales Employee, so the same report serves both a customer-facing and a sales-team-facing view
Running totals : cumulative Delta and Sales figures calculated natively across the fiscal year, updating automatically as new transactions come in
Suppress conditions : conditional row/section suppression used to hide zero-value or irrelevant rows, keeping the report clean instead of cluttered with blank lines
Custom formula fields : Delta (Projection minus Sales), Trend %, and average calculations (Avg. Required Sales, Avg. Actual Sales, Avg. Pending Sales) all built as Crystal formulas rather than static values
Query developed in SAP B1 HANA via HANA Studio : the underlying dataset is a HANA calculation view/query, so the report reflects live transactional data instead of a manual export
Why this report matters to a business:
Turns a static sales target into a living comparison instead of just "did we hit the number," it shows how far off per customer, per month, and whether the trend is improving or worsening
Surfaces problem accounts early a customer with a large negative Delta and falling Trend % is visible immediately, instead of being buried in a spreadsheet
Connects projections to real pipeline Open Order values sit right next to projection and actual sales, so a manager can see how much of the gap is already covered by orders in hand
Removes manual Excel work sales teams often build this exact analysis by hand every month; here it's automated and always current
Useful at two levels the summary table for leadership, the monthly grouped detail for sales employees managing individual accounts
#SAPBusinessOne #SAPB1 #CrystalReports #SAPHANA #HANAStudio #SalesReporting #BusinessIntelligence #DataAnalytics #ERPReporting #SalesProjection #SAPB1Consultant #ReportDevelopment #DataAnalysis #QueryGenerate #AccountReports #supplierreports #QCreport #manufacturingreports #financereporting #FinancialReports #querydevelopment #technicalreportwriting
The network for creativity
Join 1.25M professional creatives like you
Connect with clients, get discovered, and run your business 100% commission-free
Creatives on Contra have earned over $150M and we are just getting started

Challenges
View all


Related posts

Excel ERP System | Sales, Purchase & Inventory Management
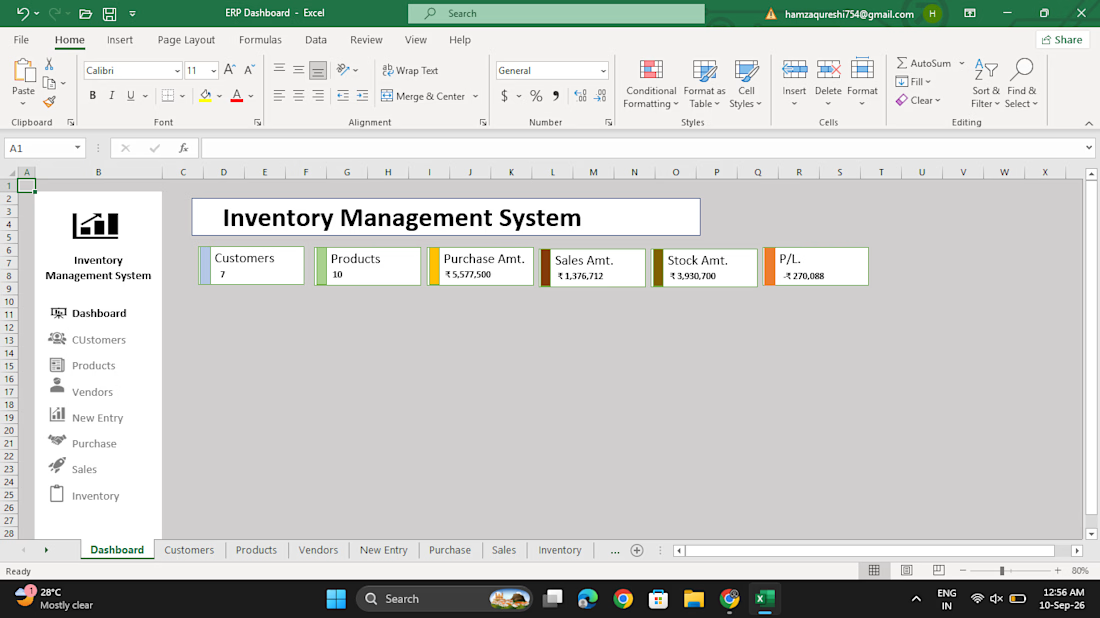
Built a practical Excel-based ERP system to manage customers, products, vendors, purchases, sales, and inventory.
The system automatically tracks purchased and sold quantities, current stock, stock value, sales, purchases, and profit/loss using Excel formulas and Pivot Tables.
Key skills: Excel, VLOOKUP, SUMIF, Pivot Tables, Inventory Management and Business Reporting.:


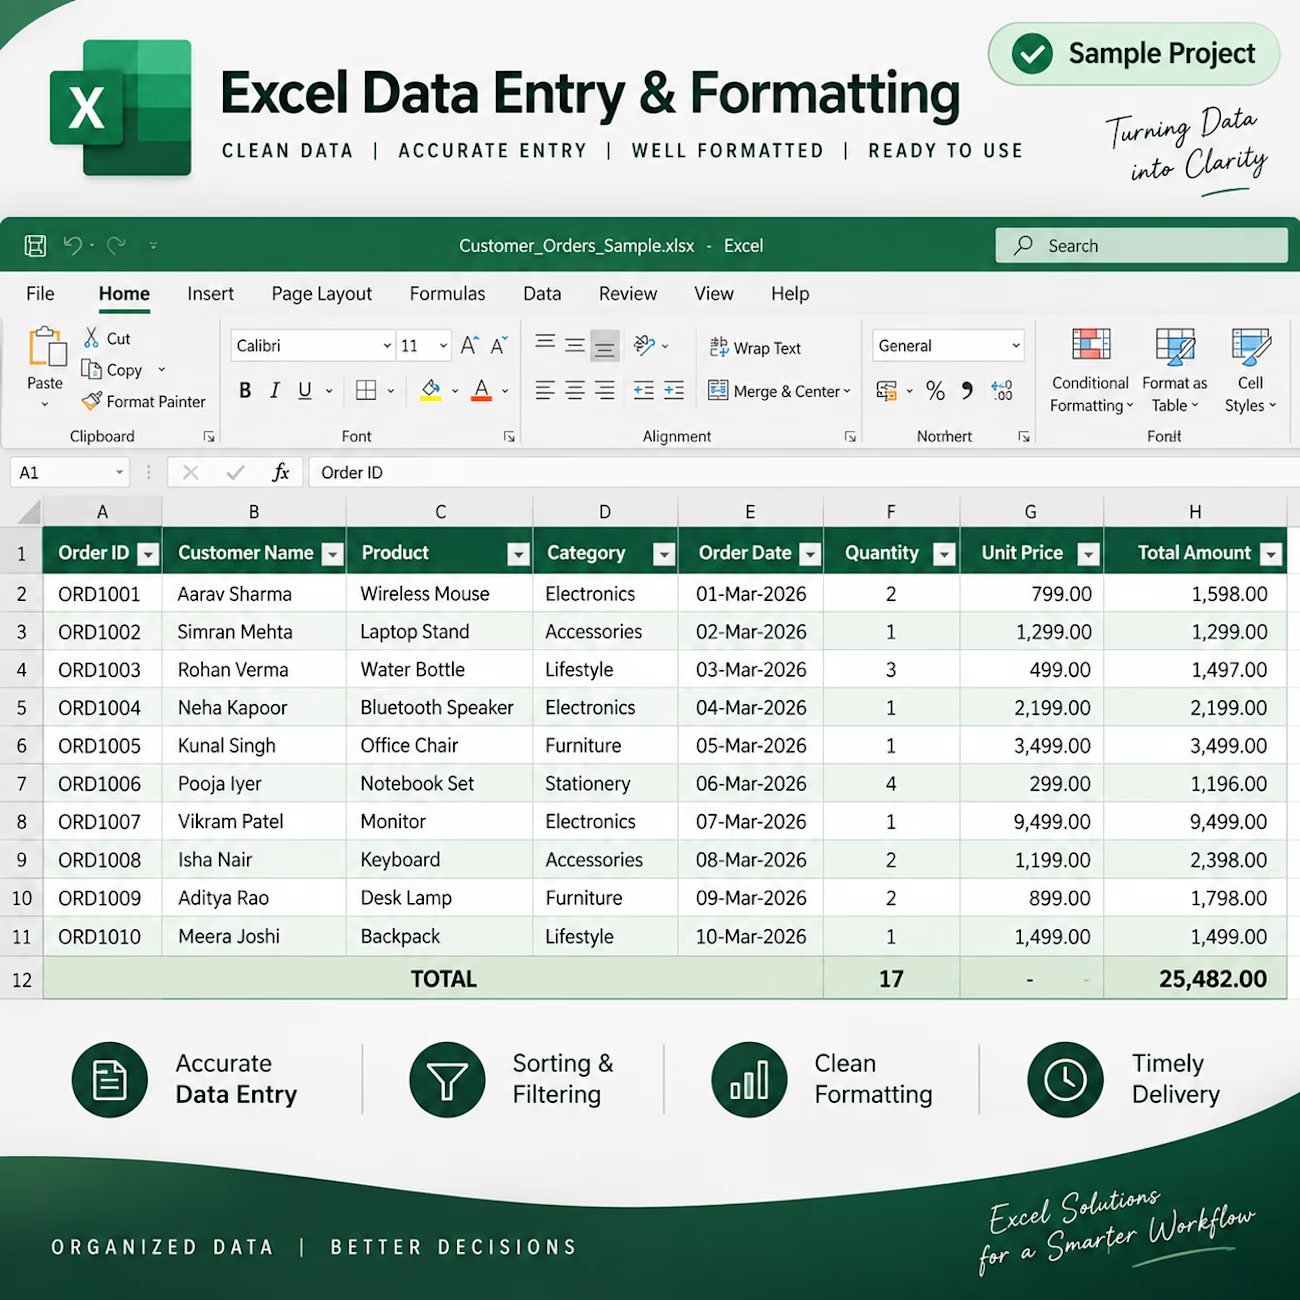
Excel Data Entry & Formatting
Description: Accurate data entry, formatting, sorting, filtering and spreadsheet organization using Microsoft Excel.



A clean, modern dashboard concept for tracking earnings, sales, visitors, and product performance — designed with a soft, minimal visual language and intuitive data hierarchy. ✨