The network for creativity
Join 1.25M professional creatives like you
Connect with clients, get discovered, and run your business 100% commission-free
Creatives on Contra have earned over $150M and we are just getting started
Back to feedPost

Donut Shop Sales & Operations Analysis: Polars, Plotly and PostgreSQL
What this is
A data analysis project that turns a donut shop's database into clear, interactive insights about sales, inventory and staff. It reads live data straight from a PostgreSQL database, so the results always match what is happening in the business. There are no manual exports and no copy-pasted spreadsheets.
Why Polars, not the usual pandas
Most data analysis today is done with pandas. For this project I used Polars, a modern, high-performance data library written in Rust. I built the shop's database to scale, and the analysis needed to scale with it.
Fast on big data: Polars uses all of your computer's CPU cores, so it stays fast as the data grows from thousands of rows to millions.
Memory-efficient: it handles large datasets without slowing down or running out of memory.
Built for growth: when the business adds more sales, customers and locations, the analysis keeps working without being rewritten.
Live connection with ConnectorX
The analysis connects to PostgreSQL through ConnectorX, a database connector built for fast loading, and it loads data directly into Polars. Each run pulls the latest data, so a client can refresh the analysis at any time and see current numbers.
Interactive charts with Plotly
All charts are made with Plotly, so they are interactive and not just pictures. Hover over any bar, line or data point to see the exact values, and zoom in or turn data series on and off to explore the details yourself.
What the analysis covers
Sales & revenue: top-selling donuts, sales trends by month, sales by
category, and total profit.
Inventory & waste: ingredient purchases, wasted donuts, and the money
lost to waste.
Staff & operations: employees by shift and age group, and
salary summaries.
Tools: Python, Polars, ConnectorX, Plotly, PostgreSQL


The network for creativity
Join 1.25M professional creatives like you
Connect with clients, get discovered, and run your business 100% commission-free
Creatives on Contra have earned over $150M and we are just getting started


Related posts

Hi, I'm Fletch. 👋
I fix messy HubSpot portals and build the automations that keep them clean.
My path here wasn't a straight line: preschool teacher, then BDR, then leading a BD team, then enablement, and now RevOps. Every one of those jobs taught me the same thing. A system only works when the people using it understand it.
That's how I approach HubSpot work. Before I build anything, I want to know how your team actually sells, where the data stops being trustworthy, and who gets stuck when something breaks.
A few recent results:
• A 2-week portal audit that surfaced 296 unused properties and a prioritized fix list
• A lifecycle-stage bug found and fixed, correcting 128 contact records
• Location values cleaned up from 600+ variations down to 0
What I help with:
HubSpot cleanup: dedupe, property rebuilds, data hygiene
HubSpot automation: workflows, routing, sequences, pipelines
Fractional RevOps and enablement, when you need more than a cleanup
I'll be sharing what I see inside real portals here: the patterns, the fixes, and the occasional workflow nobody remembers building.
If your CRM has gotten away from you, send me a note about what's broken. I'll tell you where I'd start.

Best of luck :)

What if your data looked like a beautifully printed science book?
For my first project here, I built something I dearly wanted for myself, a Genome Atlas: an editorial dashboard that reads the human genome like a book, chapter by chapter.
Three billion letters. Twenty thousand genes. Sixty-four codons that spell only twenty amino acids. I wanted to turn these numbers into something you feel before you read it: soft pastel watercolour, clean ink lines, and charts you can play with.
Ten chapters, ten ways to see data: chromosomes as gel lanes you can sort, a wheel of the genetic code that lights up every synonym, base pairs drawn like a chemistry textbook, and an animated flow that shows what you inherited from each grandparent.
Every figure comes with its source, because beautiful should never mean approximate.
It's now available for use here!


Turning 3 billion base pairs into a soft watercolour science book is seriously next-level craft, Sarah!
Quick nerd note from the startup legal side, since you're selling this as a digital product, adding a clear Single-User vs. Commercial License note (and a no-redistribution...

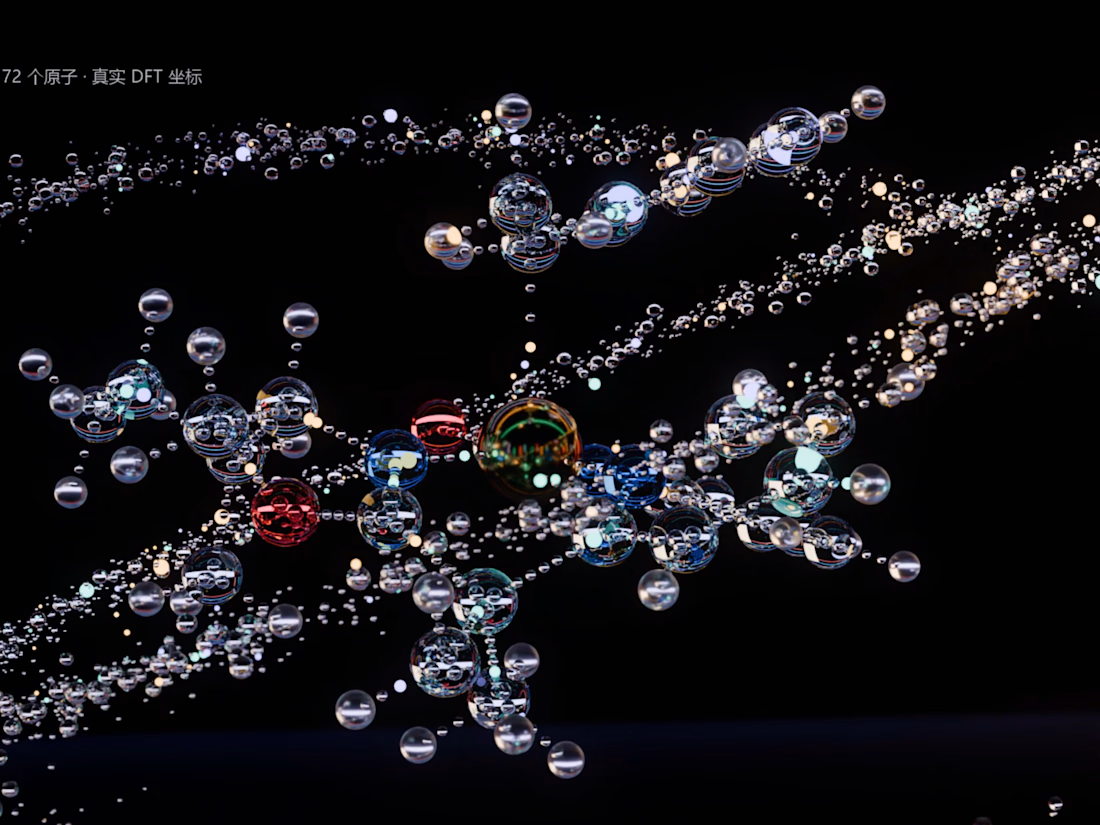
A 100% procedurally generated 3D animation rendered in Blender Cycles with zero manual modeling. Driven entirely by Python code, 4,883 refractive glass spheres