The network for creativity
Join 1.25M professional creatives like you
Connect with clients, get discovered, and run your business 100% commission-free
Creatives on Contra have earned over $150M and we are just getting started
Back to feedPost

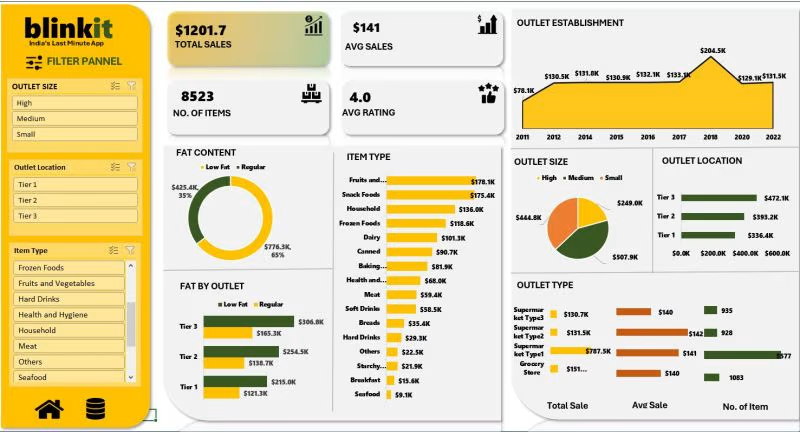
I built a full sales dashboard for a Shopify skincare brand (Sarah's Glow Co.) from raw, messy order data — inconsistent date formats, missing discount codes, and mixed-case order statuses.
I cleaned and standardized the dataset, then used PivotTables, PivotCharts, and SUMIF/COUNTIFS formulas to build a dashboard tracking total revenue, average order value, refund rate, monthly revenue trends, top-selling products, and discount code performance.
The result: a single dashboard that turns scattered order data into a clear view of what's actually driving revenue and where fulfillment issues are costing the business money.


The network for creativity
Join 1.25M professional creatives like you
Connect with clients, get discovered, and run your business 100% commission-free
Creatives on Contra have earned over $150M and we are just getting started





Related posts


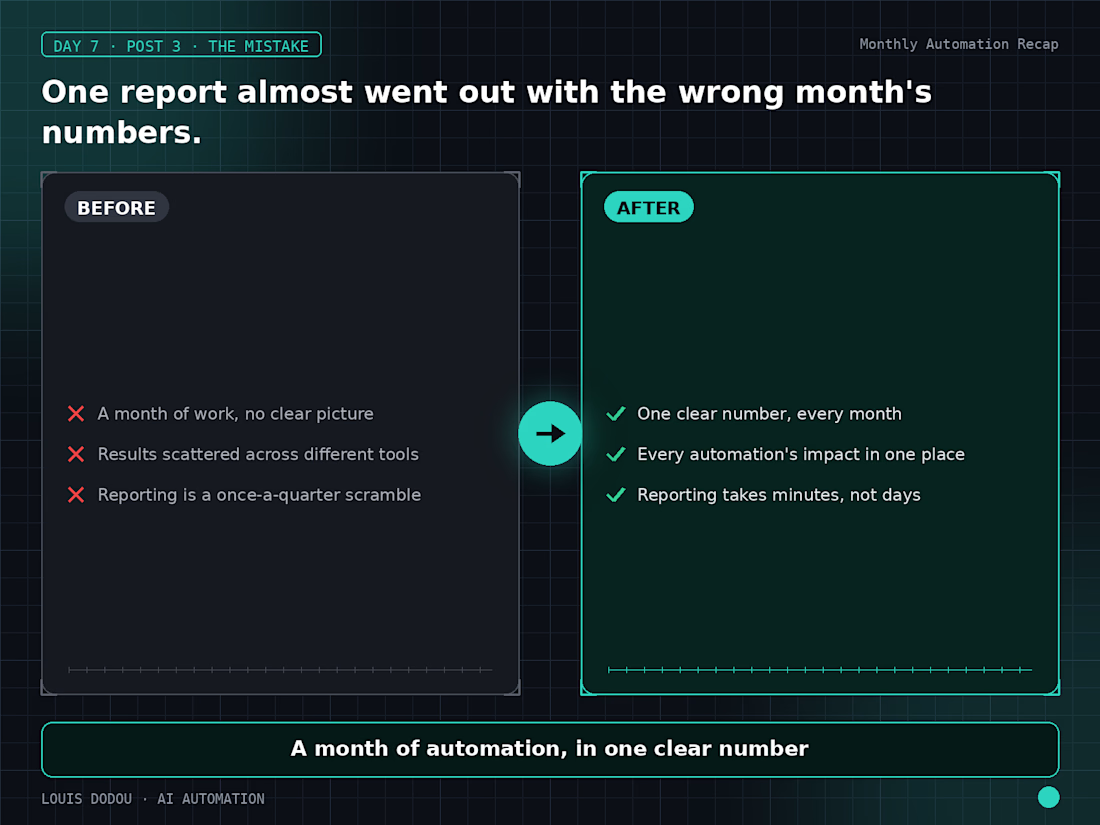
One report almost went out with the wrong month's numbers.
A dashboard hadn't refreshed before the export ran. Caught it before it sent now every report confirms the data's freshness before it goes out, not after.
→ Automating the report still needs one manual check: is this actually current?



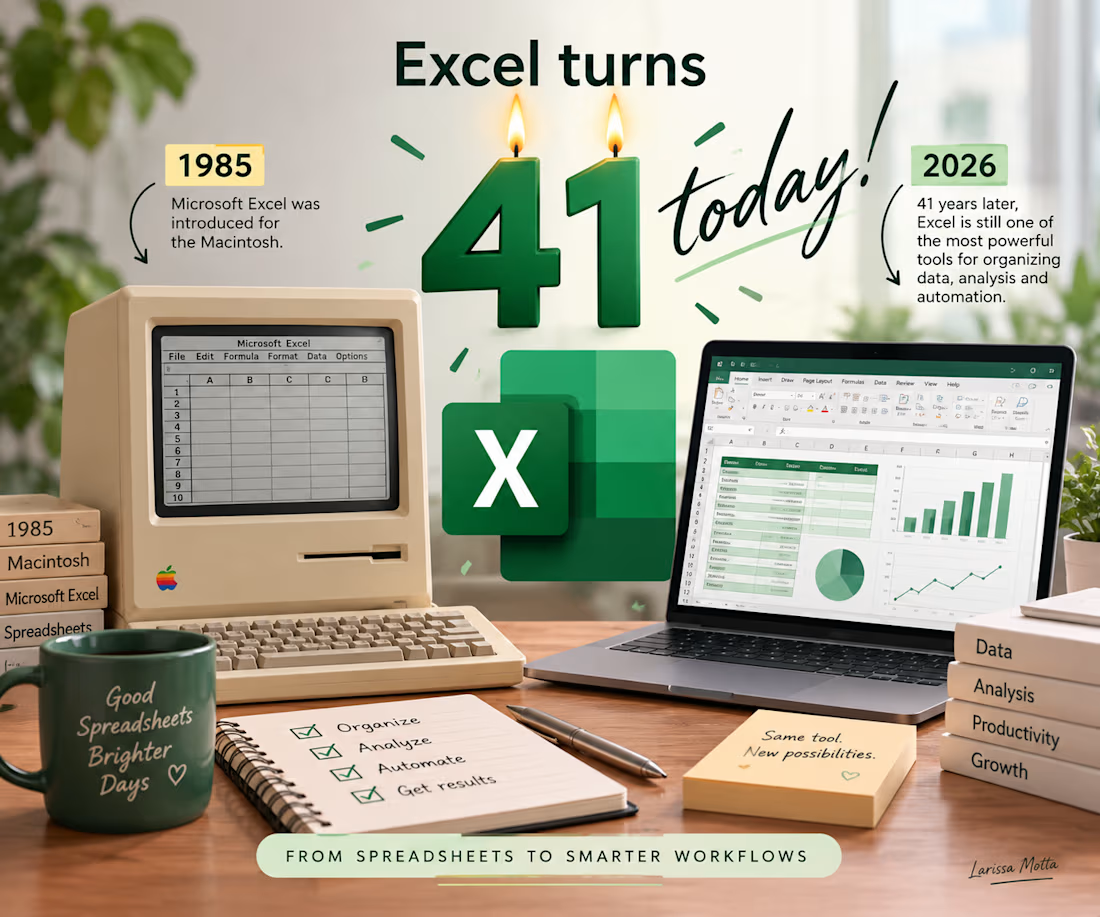
🎂 Excel turns 41 today!
On September 30, 1985, Microsoft Excel was introduced for the Macintosh.
41 years later, Excel is still one of the tools I use most in my professional work - from organizing data and financial information to creating structured spreadsheets and reports.
What started as a spreadsheet has become a powerful tool for analysis, organization, and automation.
Happy birthday, Excel! 🎂📊
And here's to many more years of spreadsheets, formulas, and probably a few #VALUE! errors along the way 😂