The network for creativity
Join 1.25M professional creatives like you
Connect with clients, get discovered, and run your business 100% commission-free
Creatives on Contra have earned over $150M and we are just getting started
Back to feedPost

Solar Energy Tracker & Smart Battery Management App UI Design
As residential solar installations and home battery storage scale globally, homeowners demand real-time visibility into their power generation, grid independence, and daily cost savings.
We designed this modern Solar Energy Tracker & Smart Battery Management Mobile UI to make complex energy telemetry digestible and visually engaging. Built for CleanTech startups, solar inverter brands, EV charging networks, and smart home IoT platforms, this warm, minimalist mobile interface turns intricate power metrics into actionable energy insights.
The Problem We Solved
Most energy management platforms overload users with confusing technical jargon, unreadable raw data tables, and disconnected system metrics. For everyday homeowners, understanding power flow between solar panels, battery reserves, home consumption, and the electrical grid feels like reading a utility bill without a key.
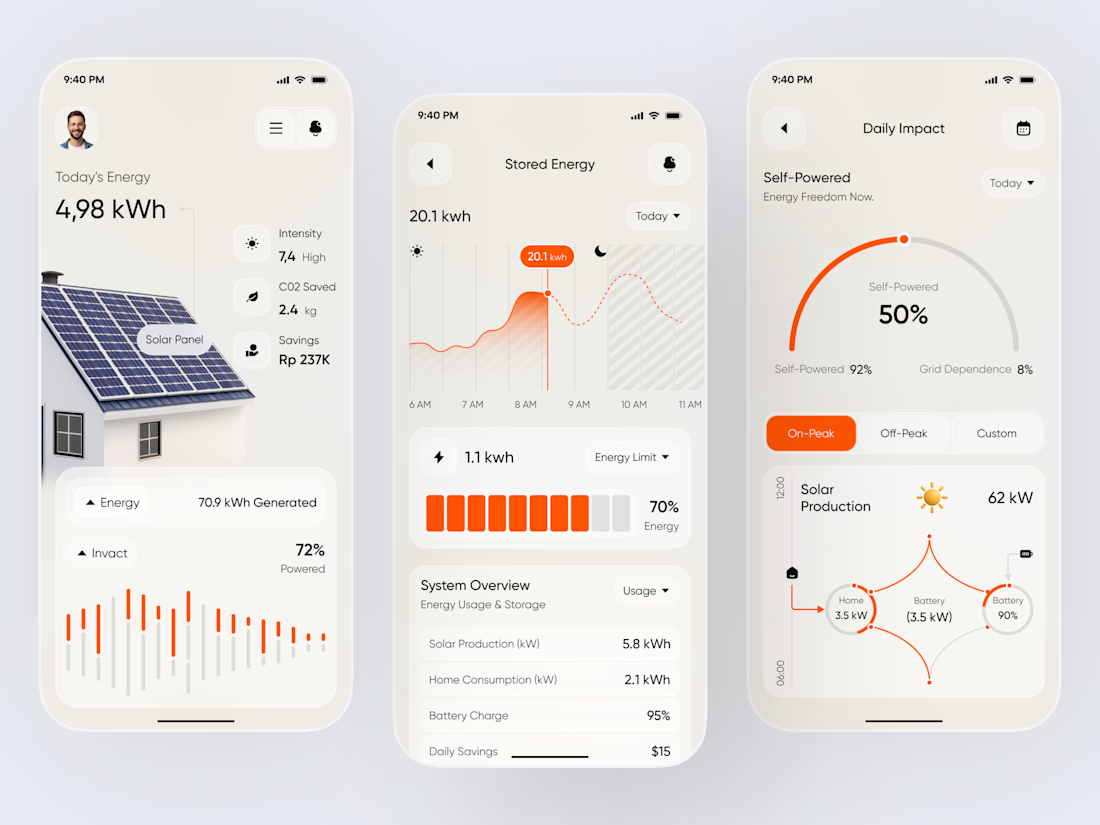
This concept prioritizes visual clarity and flow mechanics through intuitive power node diagrams, real-time generation trackers ($4.98\text{ kWh}$), $CO_2$ offsets, and dynamic battery reserve cards.
Key Features & UX Highlights
Real-Time Generation & Carbon Metrics: High-visibility hero widget highlighting real-time output ($70.9\text{ kWh Generated}$), solar intensity, $CO_2$ saved ($2.4\text{ kg}$), and monetary daily savings.
Interactive Energy Storage & Load Curves: Granular line and bar graphs tracking hourly stored energy ($20.1\text{ kWh}$) and peak vs. off-peak consumption limits.
Self-Powered & Grid Dependence Gauge: Visual radial arc showing $50\%$ self-powered autonomy ($92\%$ peak self-power vs. $8\%$ grid reliance).
Dynamic Node System Power Flow: Interactive visual node architecture displaying live power distribution between Solar Production ($62\text{ kW}$), Home Usage ($3.5\text{ kW}$), and Battery Reserve ($90\%$ Charge).
Building a CleanTech, Solar, or Smart IoT Mobile App?
Whether you're an ambitious founder launching a renewable energy management platform or an IoT hardware brand scaling consumer-facing software, we design high-retention, user-centric UI/UX that makes sustainable living effortless.
Let's Collaborate on Something Amazing!
We are available for new projects! Let's create impactful, innovative designs together.



Beautiful solar energy dashboard—clean visuals, smart UX, and impressive data presentation! ☀️

Bravo

This is good!! the solar production graph is interesting!! first time seeing something like this
The network for creativity
Join 1.25M professional creatives like you
Connect with clients, get discovered, and run your business 100% commission-free
Creatives on Contra have earned over $150M and we are just getting started





Related posts

What if you could explore a basketball arena in 3D before booking your seat?
You found the game. But before you pay, how do you know which seat is worth it? A flat seating chart gives you a section and a number, but it can be hard to picture your position relative to the court.
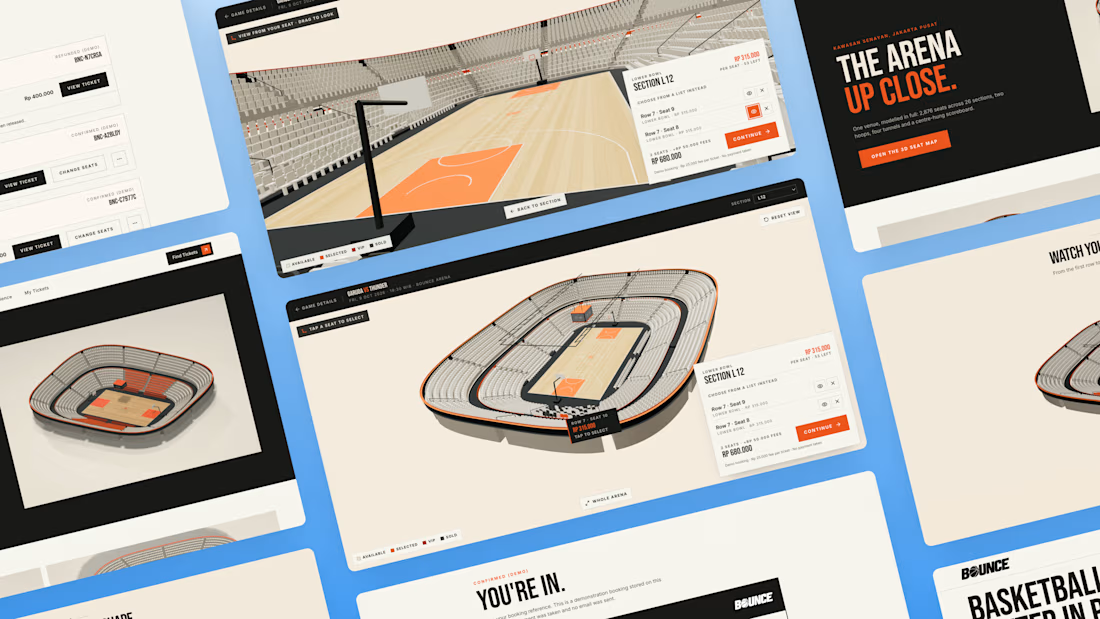
So I built BOUNCE with Lovable, a basketball ticketing concept centered around interactive 3D seat selection.
Rotate the stadium, zoom into the stands, explore different sections, and compare prices before choosing your seats directly inside the 3D arena. The goal is simple: help fans feel more confident about where they’re sitting before they book.
From there, complete checkout and get a ticket you can view, save, or print. My Tickets brings bookings together, with a one-time seat change for the same game and refund requests for eligible bookings.
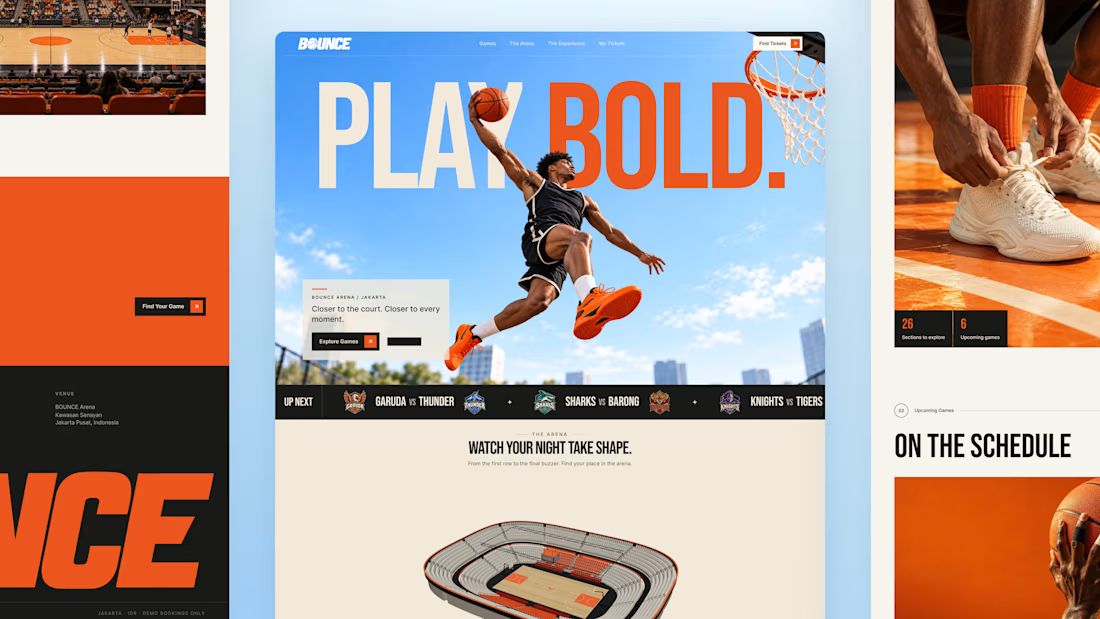
Bold orange, oversized typography, and scroll driven motion bring the energy of basketball into the experience.
Try the demo: https://bouncebasketball.lovable.app/
Fictional teams. Simulated payments. No real charges.
Less guesswork. More game. BOUNCE. Your game. Your view.



The 3D elements, especially seat pov idea is very interesting🔥


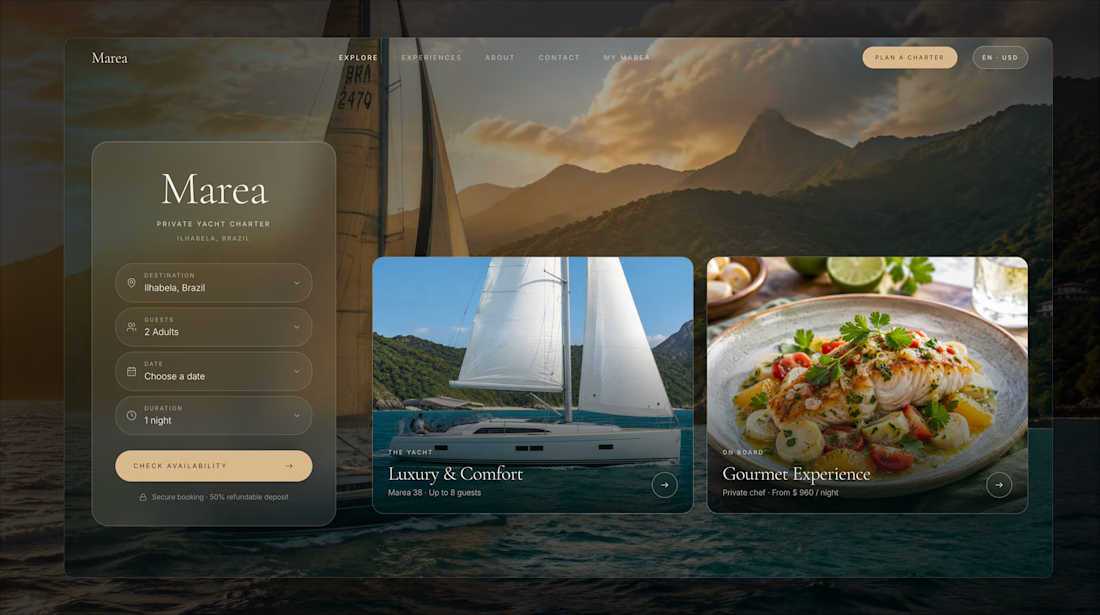
Marea — Private Yacht Charter
Booking a yacht sounds simple.
Until a guest wants a sunset dinner for six.
Now someone has to check availability, coordinate the yacht and chef, confirm the menu, collect dietary requirements, arrange the extras, and keep an eye on the weather.
For a small charter business, that can mean a lot of back-and-forth before a booking is actually confirmed.
So I built Marea around a simple idea:
The guest should choose the experience. Marea should handle the coordination.
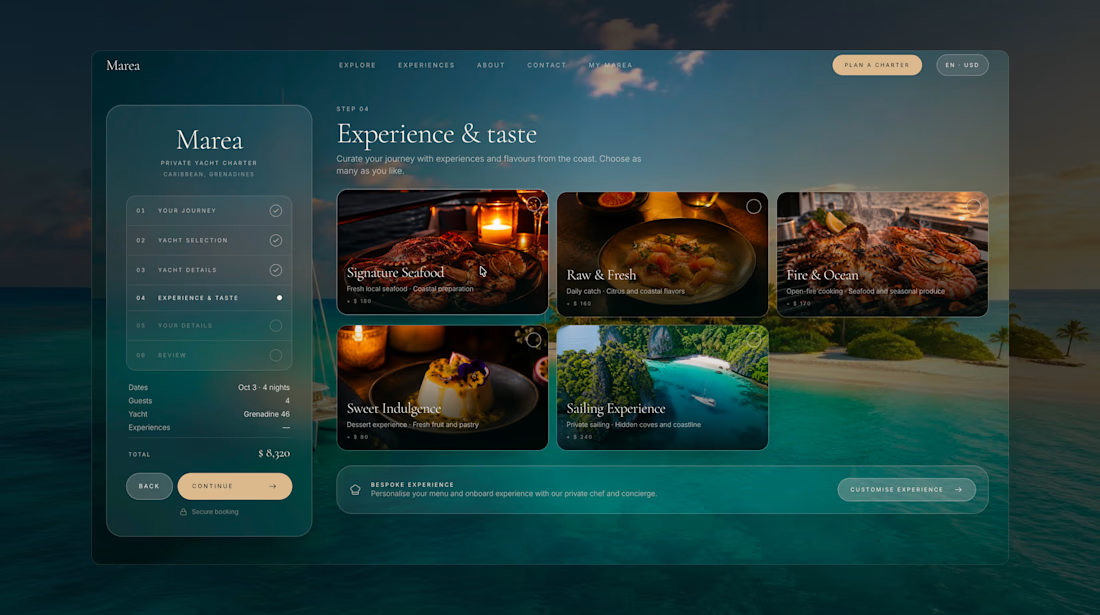
Instead of starting with a long inquiry form, guests can build their trip visually, choosing the destination, date, yacht, experience, dining options, and preferences through one guided flow.
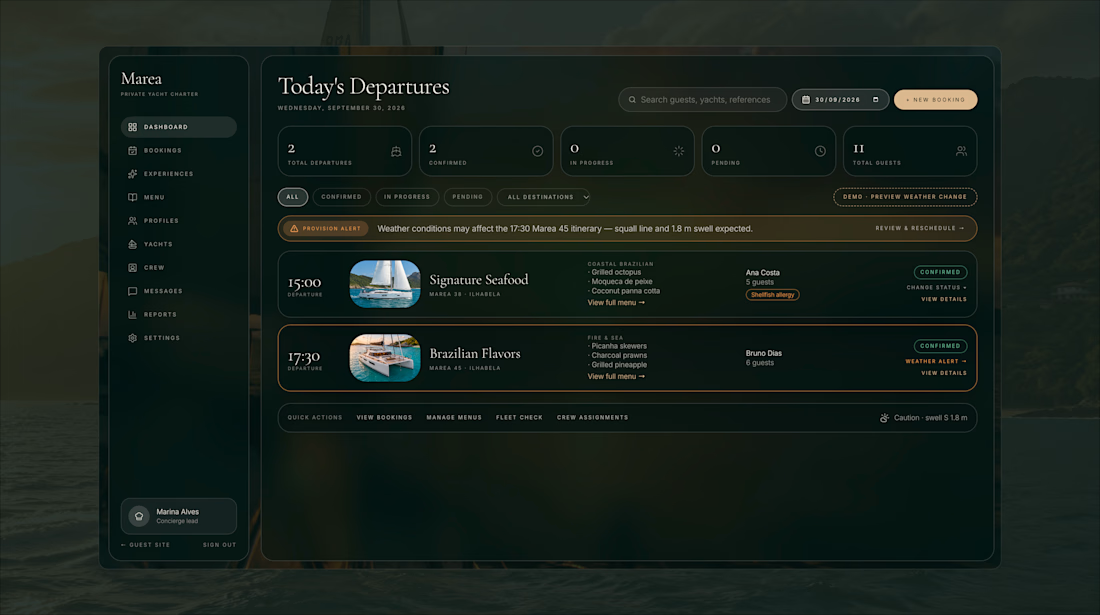
Behind the scenes, the concierge gets everything they need in one place: guest details, preferences, special requests, payment, and trip status.
And because sailing doesn't always go according to plan, Marea also brings weather and rescheduling into the booking experience.
One booking. Boat, chef, dinner, and everything in between.

This is stunning, sign me up, where do I book?! 😅

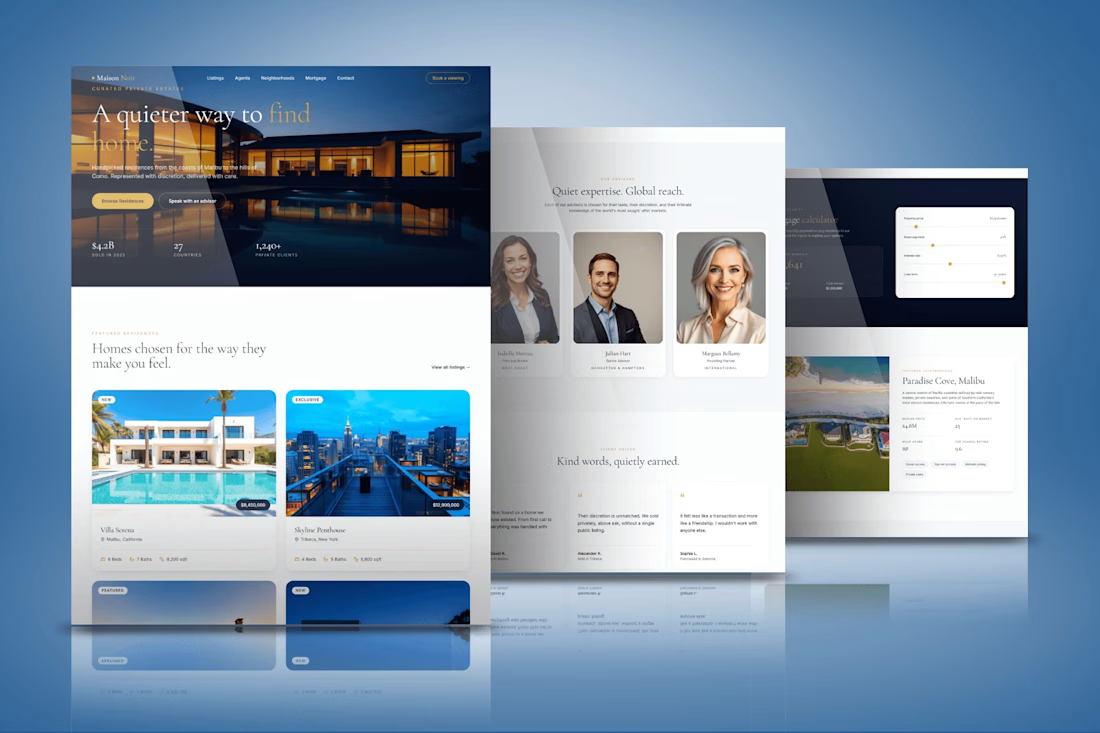
This project involved designing a website for Maison Noir, a private real estate platform focused on curated, handpicked residences for discerning clients. The homepage opens with a striking dusk photograph of a modern villa paired with the line "A quieter way to find home," immediately setting a tone of quiet luxury rather than typical high volume real estate marketing. Trust is built early through a simple stats bar showing total value sold, countries covered, and private clients served. The listings section presents featured residences like Villa Serena in Malibu and a Skyline Penthouse in Tribeca with clean pricing, bed and bath counts, and square footage, while an advisor section introduces the team behind each region with a calm, editorial photography style. Client testimonials are framed as "kind words, quietly earned," reinforcing the discreet, relationship driven positioning of the brand. A supporting mortgage calculator and neighborhood insight page round out the experience with practical tools alongside the aspirational content. Typography leans on an elegant serif paired with warm gold accents against deep navy and clean white sections, giving the whole site a restrained, high end feel throughout.