The network for creativity
Join 1.25M professional creatives like you
Connect with clients, get discovered, and run your business 100% commission-free
Creatives on Contra have earned over $150M and we are just getting started
Back to feedPost
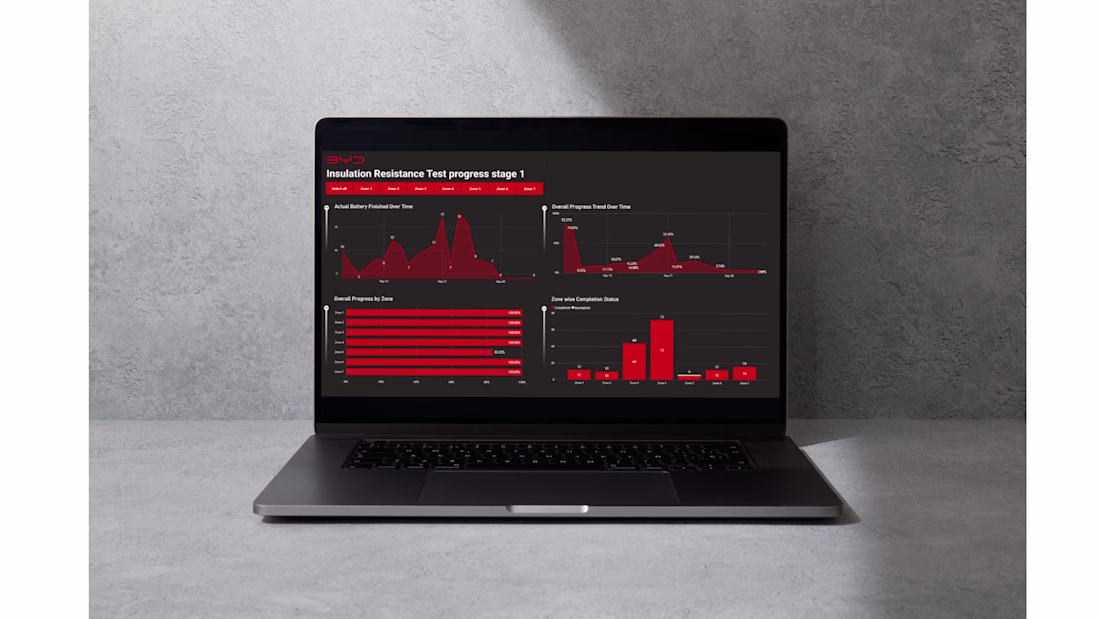
BYD Cover Installation Progress Dashboard | Project Management (Sep 2025)
Built a Power BI progress tracking dashboard for a BYD cover installation project spanning 7 zones. The dashboard surfaces real-time completion rates by zone, daily installation counts, and cumulative progress trends to give project managers a clear picture of where work is on track and where it is stalled.
Key findings surfaced by the dashboard: Zones 5 and 6 are fully complete and Zone 7 is at 98.75%, while Zones 1, 2, and 3 have not started — creating a visible backlog risk. Daily output has been highly volatile, with peaks of 680 installations and multiple zero-progress days, pointing to either work stoppages or reporting gaps.
The dashboard enabled the team to identify resource reallocation opportunities from completed zones, investigate zero-progress days, and prioritize initiation of the three unstarted zones to protect the delivery timeline.
The network for creativity
Join 1.25M professional creatives like you
Connect with clients, get discovered, and run your business 100% commission-free
Creatives on Contra have earned over $150M and we are just getting started
Related posts
Retail tools today are either too complex… or too limited.
So I built something better.
Apni Dukaan is a smarter way to manage and understand your business — without the clutter, confusion, or unnecessary features.
What it brings to the table:
• Clean, powerful insights that actually make sense
• Built for real-world usage, not just dashboards
• Fast, intuitive, and easy to get started
• Scales as your business grows
It’s not about adding more features — it’s about building the right ones.
🎥 Demo video attached — would genuinely love your feedback.
If you’re into startups, SaaS, or building useful products, let’s connect.
#buildinpublic #startup #saas #indiebuilder
React Native DevelopmentProduct Data AnalyticsWeb DevelopmentGitHubVercelVisual Studio Codeecommercebuildinpublicanalytics
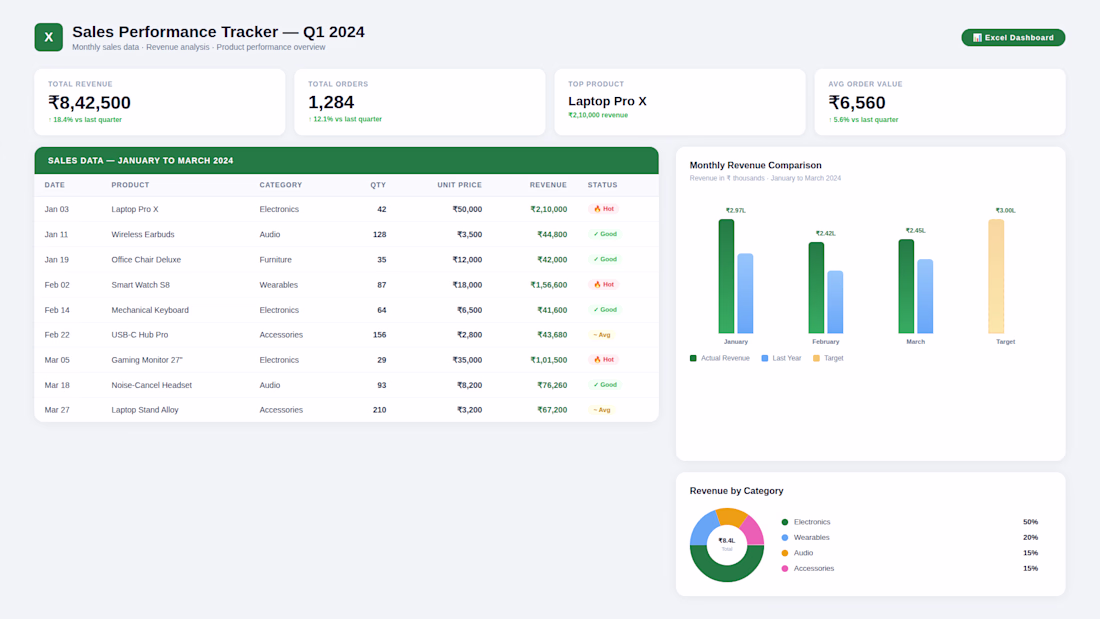
:Sales Performance Dashboard — MS Excel·
Custom Excel dashboard with sales tracking, revenue charts, and category analysis.
AXIOM — AI-powered SaaS platform.
Full pricing. FAQ. Dashboard preview.
axiom-eight-rose.vercel.app
Great one
Trending
Claude
Claude has entered the design space. How are you using Claude Design?
Contra University
Learn from expert creatives how to earn more using next-gen AI tools.
creativeaiflow
Creative AI workflows are evolving. What tools do you use, and what are their strengths and weaknesses?
portfolioreview
The best portfolios tell a story, not just show a grid. Share yours for feedback.
freelancerlife
Freelancer life is wins, pivots, and everything in between. What’s yours right now?