The network for creativity
Join 1.25M professional creatives like you
Connect with clients, get discovered, and run your business 100% commission-free
Creatives on Contra have earned over $150M and we are just getting started
Back to feedPost

AI Innovation : Dynamic Graph Automation Using Playwright and GPT-4 Vision
Objective
The goal is to automate the validation of chart data (e.g., bar and line charts) rendered via <canvas> elements. These charts are typically inaccessible via standard DOM selectors, so we use AI to visually extract and compare data against source values from Excel files or API response
Validates charts even without DOM access
Enables testing of visual business KPIs (e.g., spend, pricing trends)
Easily scales across apps using similar charting libraries
Reduces reliance on fragile CSS selectors or internal JS objects
Bridges the gap between visual UI and backend accuracy


The network for creativity
Join 1.25M professional creatives like you
Connect with clients, get discovered, and run your business 100% commission-free
Creatives on Contra have earned over $150M and we are just getting started



Related posts

New here, so I'm slowly filling in my portfolio and getting to know the place. So far I like it.
Here's an extract from Software Intelligence, a Framer site I designed and built a few months ago for an enterprise data consulting startup.
The visual idea mirrors what they do with data: compact blocks that animate, break apart and recompose, like charts taking shape. Few effects, all consistent, everything managed through the CMS.
If you have a minute, take a look at the full case study.
I'd love to know what you think, especially whether the motion supports the content or ends up overpowering it.


You're very welcome, Francesco — glad the note landed. The motion in that extract really does the heavy lifting for the content, so keep sharing your work here. Looking forward to seeing what's next from you. ✌️

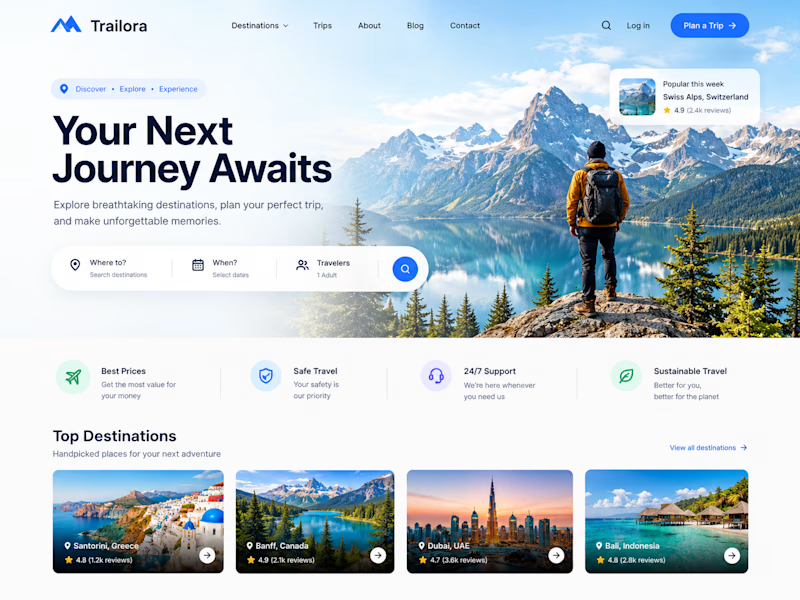
Two designs. One idea. Two different ways to experience travel. ✈️
What if planning your next trip felt less like managing a checklist and more like discovering a story waiting to unfold?
Trailora makes discovery feel effortless, while Horizon turns travel planning into a smarter, more structured experience.
Same industry. Different design directions.
Which direction would you choose: the freedom to explore or the confidence of a well-planned journey?
25 voted
71%
10 voted
29%

35 votes
Closed

Both are lovely! The second one feels more like an adventure, which fits travel well.


