The network for creativity
Join 1.25M professional creatives like you
Connect with clients, get discovered, and run your business 100% commission-free
Creatives on Contra have earned over $150M and we are just getting started
Back to feedPost

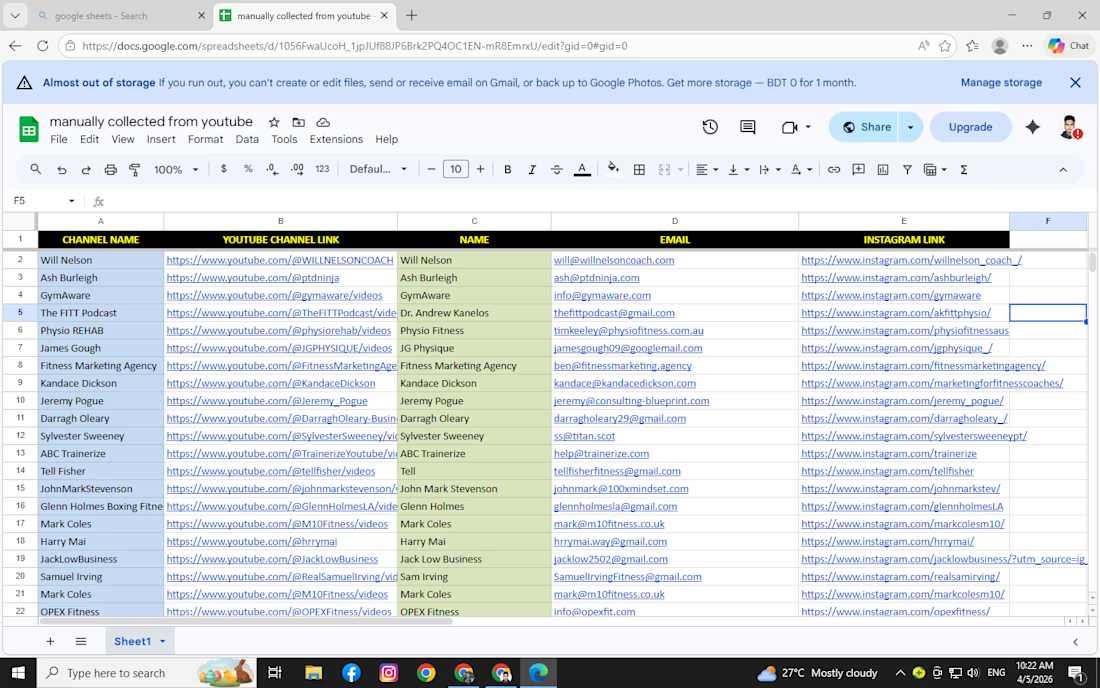
👉 YouTube Lead Generation (Manual Research)


The network for creativity
Join 1.25M professional creatives like you
Connect with clients, get discovered, and run your business 100% commission-free
Creatives on Contra have earned over $150M and we are just getting started











Related posts

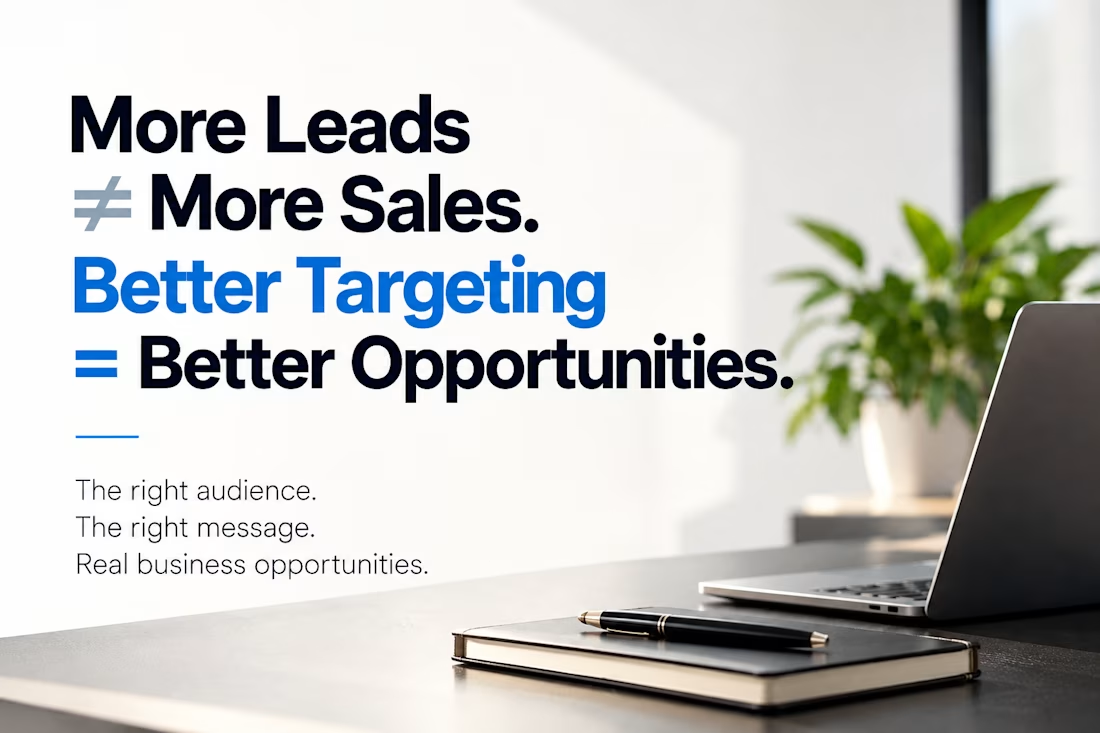
🚨 Your Lead Generation Isn't Failing. Your Targeting Might Be.
𝟏,𝟎𝟎𝟎 𝐫𝐚𝐧𝐝𝐨𝐦 𝐥𝐞𝐚𝐝𝐬 𝐨𝐫 𝟏𝟎𝟎 𝐩𝐫𝐨𝐬𝐩𝐞𝐜𝐭𝐬 𝐰𝐡𝐨 𝐚𝐜𝐭𝐮𝐚𝐥𝐥𝐲 𝐧𝐞𝐞𝐝 𝐲𝐨𝐮𝐫 𝐬𝐞𝐫𝐯𝐢𝐜𝐞?
I'd choose the 100. Every. Single. Time.
𝐇𝐞𝐫𝐞'𝐬 𝐭𝐡𝐞 𝐮𝐧𝐜𝐨𝐦𝐟𝐨𝐫𝐭𝐚𝐛𝐥𝐞 𝐭𝐫𝐮𝐭𝐡 𝐚𝐛𝐨𝐮𝐭 𝐁𝟐𝐁 𝐥𝐞𝐚𝐝 𝐠𝐞𝐧𝐞𝐫𝐚𝐭𝐢𝐨𝐧:
_ More connections don't mean more clients.
_ More messages don't mean more meetings.
_ More automation doesn't mean more revenue.
You can't automate your way out of bad targeting.
After 3+ years working in B2B lead generation and outbound outreach, I've learned one thing:
The best outreach campaigns are won BEFORE the first message is sent.
Here's what separates strategic outreach from simply sending messages:
𝐓𝐚𝐫𝐠𝐞𝐭 𝐭𝐡𝐞 𝐑𝐈𝐆𝐇𝐓 𝐜𝐨𝐦𝐩𝐚𝐧𝐢𝐞𝐬. Your ideal customers aren't everyone in your industry.
𝐅𝐢𝐧𝐝 𝐭𝐡𝐞 𝐑𝐄𝐀𝐋 𝐝𝐞𝐜𝐢𝐬𝐢𝐨𝐧-𝐦𝐚𝐤𝐞𝐫𝐬. Reach people who have the authority, influence, or need to consider your solution.
𝐑𝐞𝐬𝐞𝐚𝐫𝐜𝐡 𝐛𝐞𝐟𝐨𝐫𝐞 𝐲𝐨𝐮 𝐫𝐞𝐚𝐜𝐡 𝐨𝐮𝐭. A carefully researched prospect list is worth more than thousands of irrelevant contacts.
𝐒𝐭𝐚𝐫𝐭 𝐜𝐨𝐧𝐯𝐞𝐫𝐬𝐚𝐭𝐢𝐨𝐧𝐬, 𝐧𝐨𝐭 𝐬𝐚𝐥𝐞𝐬 𝐩𝐢𝐭𝐜𝐡𝐞𝐬. Nobody opens LinkedIn hoping to receive another generic copy-paste message.
𝐀𝐮𝐭𝐨𝐦𝐚𝐭𝐞 𝐭𝐡𝐞 𝐩𝐫𝐨𝐜𝐞𝐬𝐬, 𝐧𝐨𝐭 𝐭𝐡𝐞 𝐫𝐞𝐥𝐚𝐭𝐢𝐨𝐧𝐬𝐡𝐢𝐩. Tools can scale outreach, but relevance and personalization make it meaningful.
𝐅𝐨𝐜𝐮𝐬 𝐨𝐧 𝐨𝐩𝐩𝐨𝐫𝐭𝐮𝐧𝐢𝐭𝐢𝐞𝐬, 𝐧𝐨𝐭 𝐯𝐚𝐧𝐢𝐭𝐲 𝐦𝐞𝐭𝐫𝐢𝐜𝐬. Connections and replies matter, but qualified sales conversations are the real objective.
Here's what most businesses overlook:
- Lead generation isn't about convincing everyone to buy.
- It's about finding people who already have a problem your business can solve.
𝐖𝐫𝐨𝐧𝐠 𝐚𝐮𝐝𝐢𝐞𝐧𝐜𝐞 + 𝐆𝐫𝐞𝐚𝐭 𝐦𝐞𝐬𝐬𝐚𝐠𝐢𝐧𝐠 = 𝐖𝐚𝐬𝐭𝐞𝐝 𝐞𝐟𝐟𝐨𝐫𝐭.
Right audience + Relevant messaging + Consistent follow-ups = Better sales opportunities.
That's the foundation of how I approach B2B prospecting, LinkedIn outreach, and cold email campaigns.
Now, a question for the Contra community:
𝐖𝐡𝐚𝐭'𝐬 𝐭𝐡𝐞 𝐛𝐢𝐠𝐠𝐞𝐬𝐭 𝐨𝐛𝐬𝐭𝐚𝐜𝐥𝐞 𝐡𝐨𝐥𝐝𝐢𝐧𝐠 𝐛𝐚𝐜𝐤 𝐲𝐨𝐮𝐫 𝐁𝟐𝐁 𝐠𝐫𝐨𝐰𝐭𝐡?
A — Finding qualified prospects
B — Getting decision-makers to respond
C — Turning conversations into meetings
D — Building a predictable sales pipeline
👇 𝐃𝐫𝐨𝐩 𝐲𝐨𝐮𝐫 𝐚𝐧𝐬𝐰𝐞𝐫 𝐢𝐧 𝐭𝐡𝐞 𝐜𝐨𝐦𝐦𝐞𝐧𝐭𝐬. I'm curious to hear what's challenging other founders, freelancers, and sales professionals.
And if you're looking to build a smarter outbound strategy, let's connect and discuss what's possible for your business. 🤝
#B2BLeadGeneration #LinkedInOutreach #BusinessDevelopment #SalesProspecting #ClientAcquisition


The best outreach campaigns are won BEFORE the first message is sent is a line worth printing, Masroor. Automate the process, not the relationship is the perfect companion. Solid strategic framing.

What are your thoughts on the ongoing Power BI conversation?
In the meantime, lets have a look at this Marketing Analytics Dashboard.


StackShortlist update: outreach tip for freelancersIf you specialise in a platform, say Shopify, Webflow or HubSpot, your best leads are businesses already running it. StackShortlist lets you pick from 3,500+ technologies and build a lead list around the exact tools you know, so every pitch can start with something specific.https://stackshortlist.dev