The network for creativity
Join 1.25M professional creatives like you
Connect with clients, get discovered, and run your business 100% commission-free
Creatives on Contra have earned over $150M and we are just getting started
Back to feedPost

From Google Sheets to Power BI: Turning Coffee Sales Data into an Interactive App! 📊
I’m excited to share my latest Coffee Sales Analysis Dashboard, built by connecting Google Sheets directly to Power BI to transform raw transaction logs into an automated, interactive visual experience.
Instead of static reports, I designed this project as a cohesive, cafe-themed application with seamless page navigation and live cloud connectivity:
🔹 Automated Google Sheets Integration: Connected Power BI directly to a Google Sheet, allowing the report to track updates seamlessly with a live Last Refresh timestamp right on the home screen.
🔹 Home Screen & Executive Summary: Features interactive month slicers alongside a dynamic chalkboard displaying key performance highlights (shown for June):
• Total Coffee Sold: 223 cups
• Total Sales Revenue: $7.62K
• Peak Sales Period: Night
• Best Performing Month Overall: March (494 cups)
• Top 3 Best-Selling Coffees: Americano with Milk (66 cups), Latte (50 cups), and Cappuccino (46 cups)
🔹 Interactive Analytics Dashboard: Users can dynamically slice data by Month, Time of Day (Morning, Afternoon, Night), and Coffee Type, complete with custom buttons to toggle between Quantity and Cost, a clear-slicers reset button, and custom visual tooltips.
🔹 Product Catalog & Dataset Views: Includes an interactive menu catalog showing drink visuals and unit pricing (such as Cappuccino at $38.70), alongside a clean table view for inspecting the full dataset totaling $112.25K in overall sales.
The network for creativity
Join 1.25M professional creatives like you
Connect with clients, get discovered, and run your business 100% commission-free
Creatives on Contra have earned over $150M and we are just getting started





Related posts

New E-Commerce Conversion & UX Copy case study live on my profile! ☕️
Specialty coffee brands often lose everyday buyers in two spots: pretentious tasting-note jargon on the product page, and subscription anxiety right before checkout.
For this self-initiated RoastCraft concept, I rewrote the path from product discovery to express checkout:
• Plain-English Flavor Copy: Swapped complex wine-style notes for clear sensory cues ("Milk Chocolate • Toasted Hazelnut • Zero Bitterness").
• Friction-Free Subscriptions: Added transparent microcopy right inside the selector ("Skip, pause, or cancel in one click — no emails required").
• Slide-Out Cart UX: Paired a dynamic free-shipping progress bar with exact roast/ship dates to lift AOV and prevent cart abandonment.
Take a look at the full breakdown on my profile and let me know if you're team Whole Bean or Espresso! 👇

Posted the hero for this coffee brand few weeks ago. here's the full page.
the subscription part matters most. one-time buyers are nice, subscribers pay every month.
so i made signing up feel easy: pick your coffee, bag size and schedule, and it shows the price and your next deliveries right away.
roasters, this is what your site could feel like.

Amazing

Shopify Website Development and Shopify SEO
From Zero to $77K+ in Sales with Shopify!
A beautiful store is great, but a store that brings traffic and turns it into sales is what grows a business.
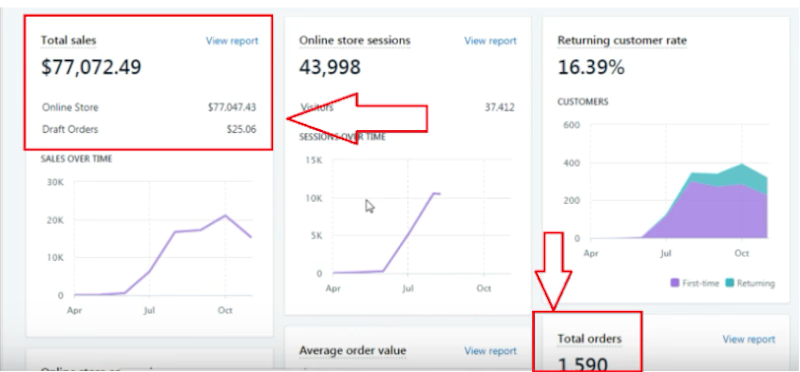
I helped build and optimize a Shopify store that generated:
💰 $77,000+ in total sales
🛒 1,590 orders
👥 43,998 store sessions
🔁 16% returning customer rate
✨ What I did:
Shopify website development and setup
Shopify SEO to bring in search traffic
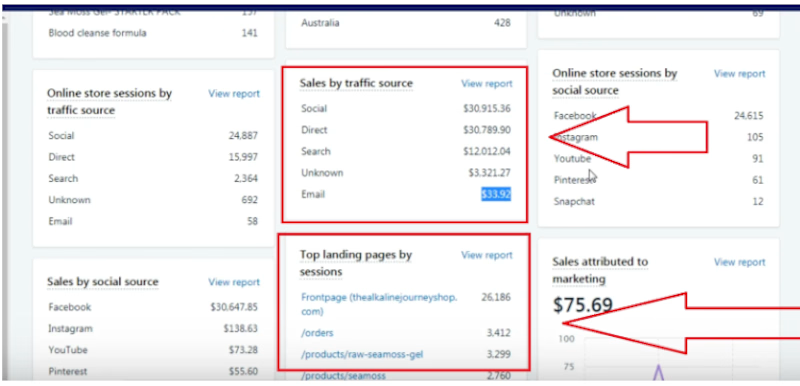
Social traffic strategy, which became the top sales source
Optimized landing pages and product pages to convert visitors into buyers
Want a Shopify store that actually sells, not just looks good? Let’s connect and grow your business together! 🚀
What’s more important for a new store: traffic or conversions?
#Shopify #ShopifyDeveloper #ShopifySEO #EcommerceGrowth #OnlineStore

For a new store, conversions first — traffic without a store that converts just burns ad spend and teaches you nothing about what visitors actually want. Your own numbers back that up: 43,998 sessions turning into 1,590 orders means the landing and product page work did the...