The network for creativity
Join 1.25M professional creatives like you
Connect with clients, get discovered, and run your business 100% commission-free
Creatives on Contra have earned over $150M and we are just getting started
Back to feedPost

Experiment No. 5
A live errors chart you can pull apart.
Grab the spike and drag it down, and the line splits into one line per service so you can see which one broke. Then drag a line to set an alert, and it shows how often it would have gone off in the last 30 days.


The network for creativity
Join 1.25M professional creatives like you
Connect with clients, get discovered, and run your business 100% commission-free
Creatives on Contra have earned over $150M and we are just getting started



Related posts

wow, this looks sharp. Amazing work


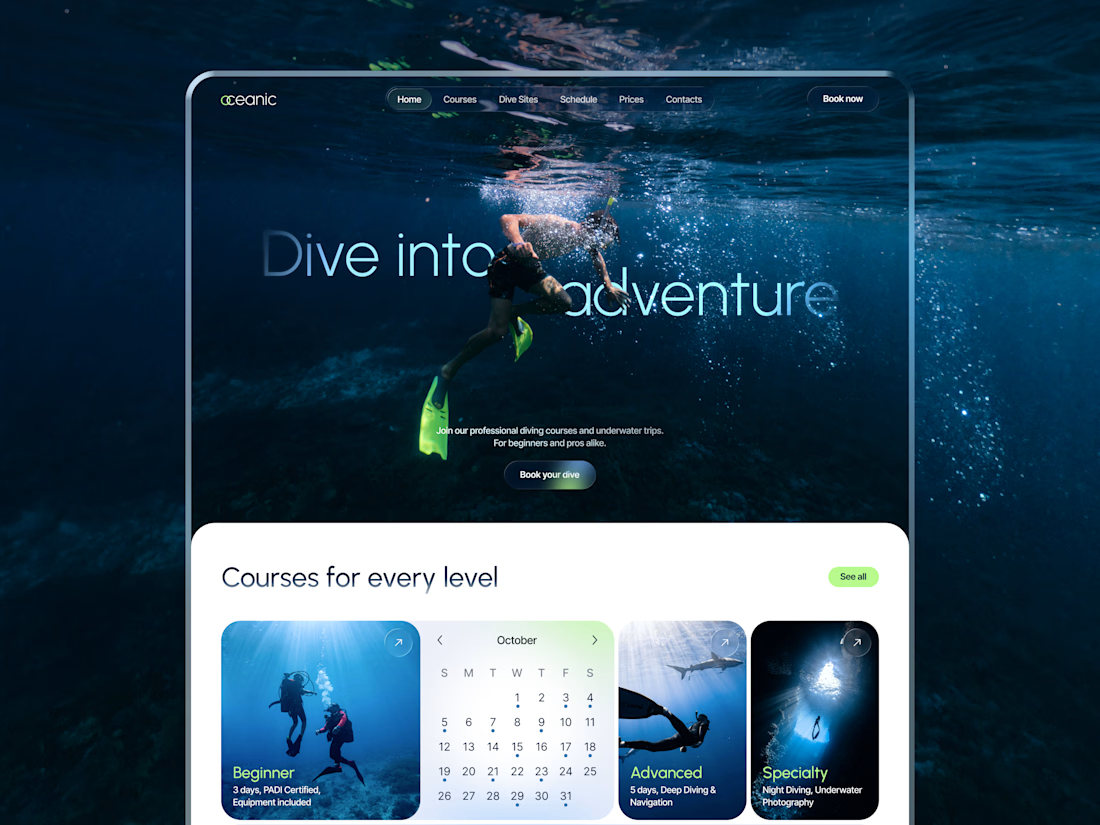
New concept for diving center 🌊
What do you think?


nice work!

Which one feels more like a brand you’d buy from?

4 voted
80%
1 voted
20%
5 votes
Closed

Loud and playful for me. The bold prints suit a small run tee brand better than a quiet layout would.

𝗗𝗮𝘆 𝟮𝟱𝘁𝗵 𝗼𝗳 𝟯𝟬𝗱𝗮𝘆𝘀, 𝟱 𝗗𝗮𝘆𝘀 𝘁𝗼 𝗴𝗼
𝗙𝗿𝗮𝗺𝗲𝗿 𝗶𝗻 𝟲𝟬 𝗦𝗲𝗰𝗼𝗻𝗱𝘀: 𝗧𝗵𝗲 𝗗𝗲𝘀𝗶𝗴𝗻𝗲𝗿’𝘀 𝗦𝗲𝗰𝗿𝗲𝘁 𝗪𝗲𝗮𝗽𝗼𝗻
𝗙𝗿𝗮𝗺𝗲𝗿 𝗳𝗲𝗲𝗹𝘀 𝗹𝗶𝗸𝗲 𝗙𝗶𝗴𝗺𝗮, 𝗯𝘂𝘁 𝗼𝘂𝘁𝗽𝘂𝘁𝘀 𝗿𝗲𝗮𝗹, 𝗹𝗶𝘃𝗲 𝗛𝗧𝗠𝗟/𝗖𝗦𝗦 𝗥𝗲𝗮𝗰𝘁 𝗰𝗼𝗱𝗲.
If you know how to design in frames and auto-layouts, you already know 80% of Framer.
Watch how fast It's to build this interactive scroll animation and publish to custom domain with zero hosting setup hassle.
𝗖𝗵𝗲𝗰𝗸 𝗼𝘂𝘁 𝗳𝗼𝗿 𝗼𝗿𝗲 𝘂𝗽𝗱𝗮𝘁𝗲 𝘁𝗼 𝗰𝗼𝗺𝗲...

Auto-layout really means and help alot in designing.