The network for creativity
Join 1.25M professional creatives like you
Connect with clients, get discovered, and run your business 100% commission-free
Creatives on Contra have earned over $150M and we are just getting started
Back to feedPost
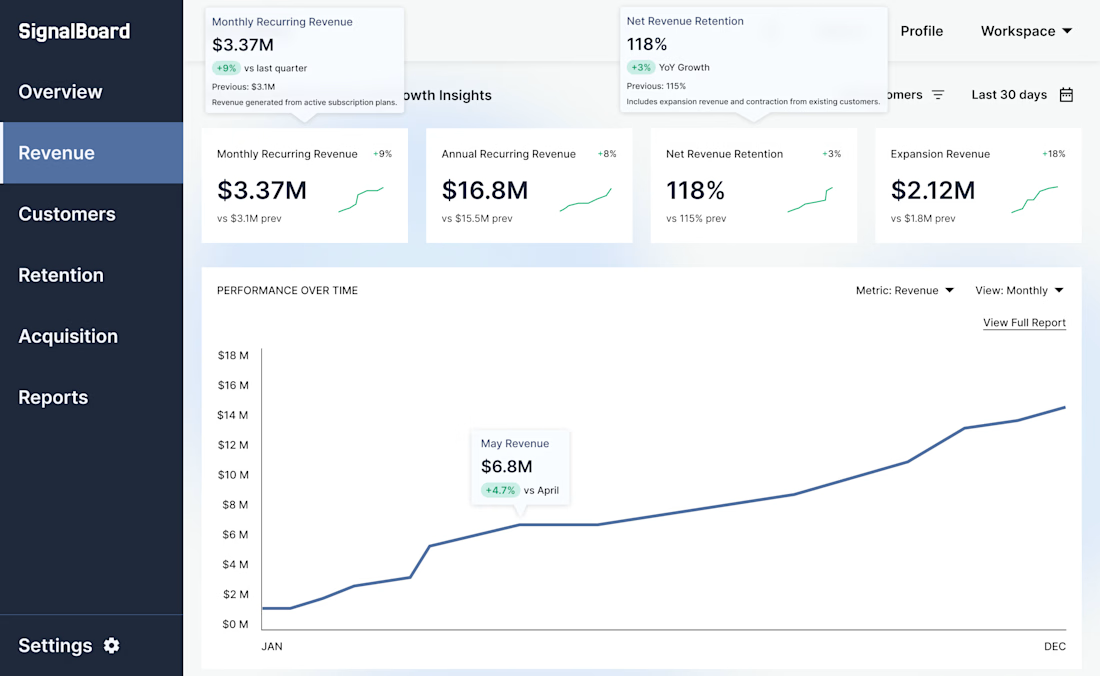
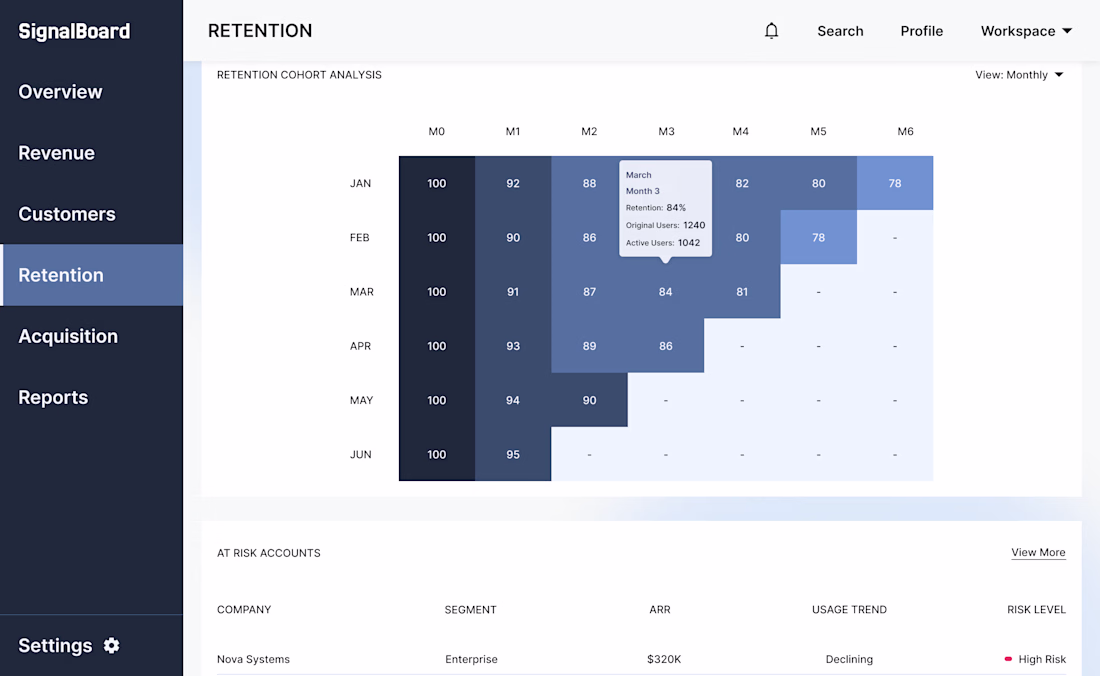
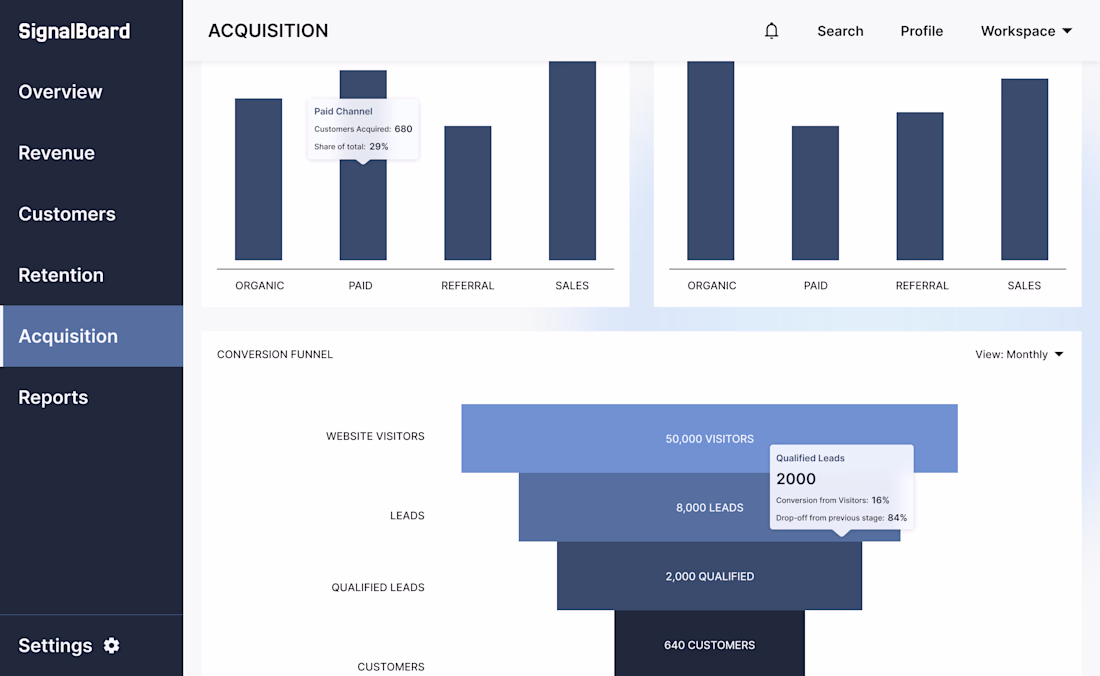
Concept product exploring SaaS analytics and executive performance dashboards.
Just finished designing SignalBoard, a SaaS analytics dashboard built to help teams understand growth metrics at a glance.
Many SaaS companies track revenue, customer growth, retention, and acquisition across multiple tools. The goal of this concept was to centralize those insights into a single analytics workspace.
The interface includes dashboards for revenue performance, customer segmentation, retention cohorts, and acquisition funnels so teams can quickly identify trends and make informed decisions.
Design focus:
• Data dense interfaces that remain readable
• Clear visualization of complex SaaS metrics
• Executive level performance monitoring
Focusing more on B2B SaaS analytics and dashboard design lately.
Really clean way of handling dense data. I love how each metric feels digestible without losing context executive dashboards often fail at readability, but this feels balanced.
The network for creativity
Join 1.25M professional creatives like you
Connect with clients, get discovered, and run your business 100% commission-free
Creatives on Contra have earned over $150M and we are just getting started
Related posts
Great work!
Awesome!
Most of the work I share early in a project is meant to feel a little uncomfortable.
Not bad, just bold. Pushed further than the brief asked, into territory the client didn’t quite realise they were ready for.
I never go too safe early on. It’s easier to pull things back than it is to start from something that feels soulless.
Here’s a glimpse of some early concepts from the Energy Central project. Some bold, some more editorial, all exploratory.
A lot of this won’t make it into the final brand, but that’s the point. It’s not wasted work – it’s what leads to a stronger result. The kind you wouldn’t arrive at if you played it safe from the start.
This is how a team learns what they’re actually ready to stand behind. The directions you reject are often the ones that lead you to the one you commit to.


looks awesome
Trending
Claude
Claude has entered the design space. How are you using Claude Design?
Contra University
Learn from expert creatives how to earn more using next-gen AI tools.
creativeaiflow
Creative AI workflows are evolving. What tools do you use, and what are their strengths and weaknesses?
portfolioreview
The best portfolios tell a story, not just show a grid. Share yours for feedback.
freelancerlife
Freelancer life is wins, pivots, and everything in between. What’s yours right now?