The network for creativity
Join 1.25M professional creatives like you
Connect with clients, get discovered, and run your business 100% commission-free
Creatives on Contra have earned over $150M and we are just getting started
Back to feedPost

Daily weight changes can lie.
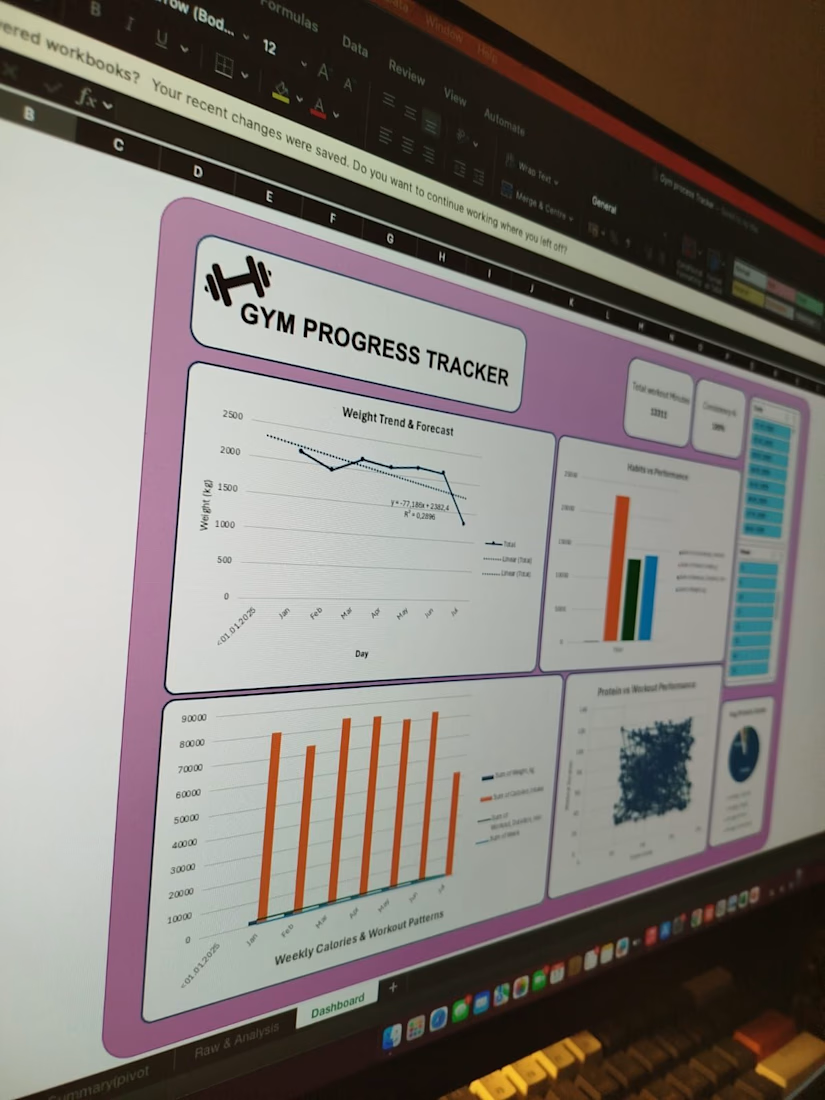
Instead of guessing what affects fitness progress, so I analyzed a gym and nutritional data using Excel to find what actually drives progress.
- Long-term weight trends rather than daily fluctuations
- Protein intake vs workout performance to assess recovery and output
- Weekly calorie and workout patterns to spot burnout and plateaus
- Consistency vs intensity to identify what truly moves results.
The insight was clear.
Consistency combined with balanced nutrition consistently outperformed intensity spikes. Weeks with stable habits showed better progress than weeks driven by extreme effort.
This project strengthened my ability to:
- Translate raw data into meaningful insights
- Build clear, decision-focused Excel dashboards
- Communicate findings in a way non-technical stakeholders can act on.


The network for creativity
Join 1.25M professional creatives like you
Connect with clients, get discovered, and run your business 100% commission-free
Creatives on Contra have earned over $150M and we are just getting started







Related posts

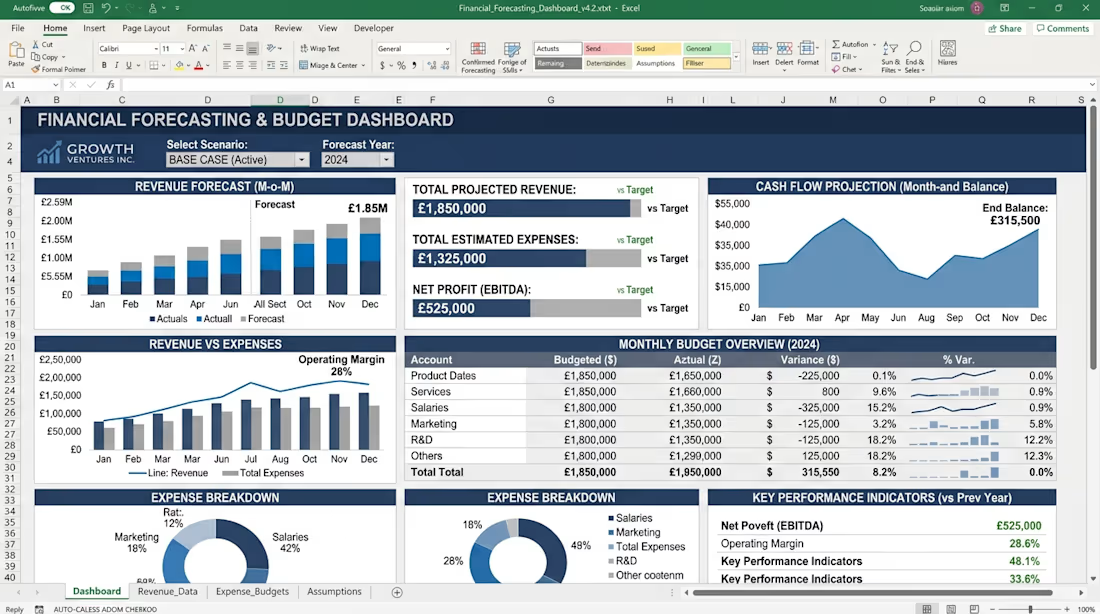
I developed an Excel-based inventory management solution to organize product records, monitor stock levels, and simplify inventory tracking. The system helps users maintain structured data, review stock information, and improve day-to-day inventory management through spreadsheet automation and clear reporting.


Two pricing scenarios can include the same studio overhead. Adding their break-even volumes together can double-count the costs they are meant to cover.
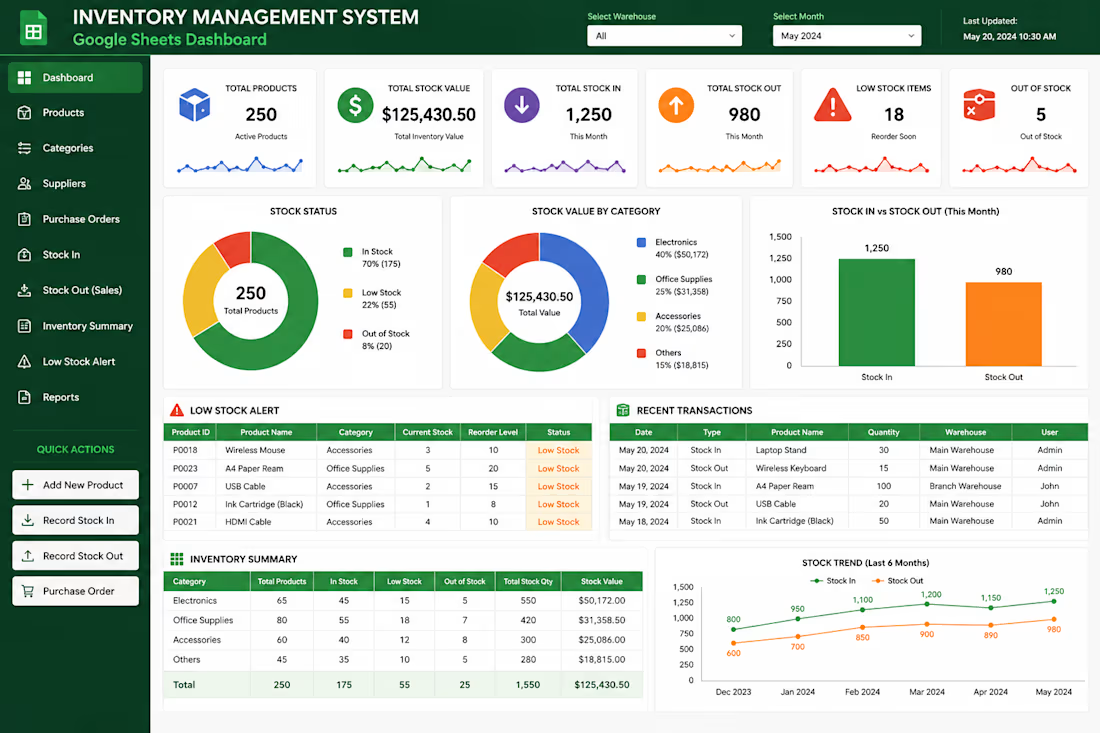
The Product Unit Economics and Break Even Kit keeps one product, channel and planning period per scenario. Its fictional desk-tray example assigns USD 1,800 in monthly studio and operating overhead to a 200-unit planning target.
Before comparing that row with another option, write down:
• Which overhead is assigned, and why
• Whether another scenario includes the same costs
• What supports the target volume
• Which production, cash or storage limits need a separate check
For example, comparing direct online sales with a wholesale option calls for separate price, fee and cost assumptions. Treat them as alternatives until you have a properly allocated combined model. A target entered in a spreadsheet is still a planning input, not evidence of demand.
The preview is the kit's actual fixed-cost and target worksheet. The download includes a five-page editable Word packet, an Excel scenario workbook, printable PDFs, a fictional completed example and a Quick Start. Built for desktop Word and Excel.
The example uses invented inputs. This simplified manual tool doesn't establish taxable profit, cash sufficiency or an appropriate selling price; consequential decisions need relevant professional review.
Get the digital kit: https://contra.com/payment-link/jF9ueVXt-product-unit-economics-and-break-even-kit
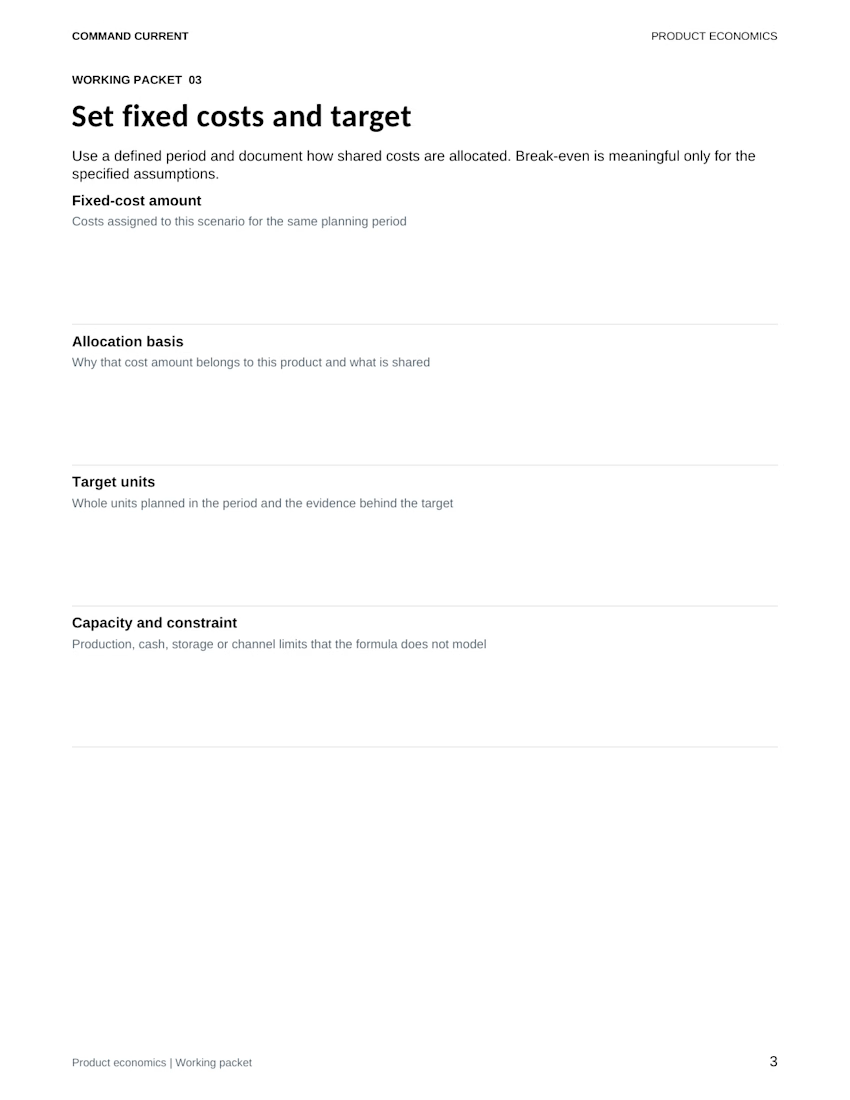
I developed a professional Excel Financial Reporting Dashboard to simplify financial data analysis and reporting. It presents key financial metrics, performance trends, and interactive charts in a clear, organized format. Using Excel formulas, data analysis, and Power Query, the solution helps streamline reporting, improve data visibility, and support better business decisions.