The network for creativity
Join 1.25M professional creatives like you
Connect with clients, get discovered, and run your business 100% commission-free
Creatives on Contra have earned over $150M and we are just getting started
Back to feedPost
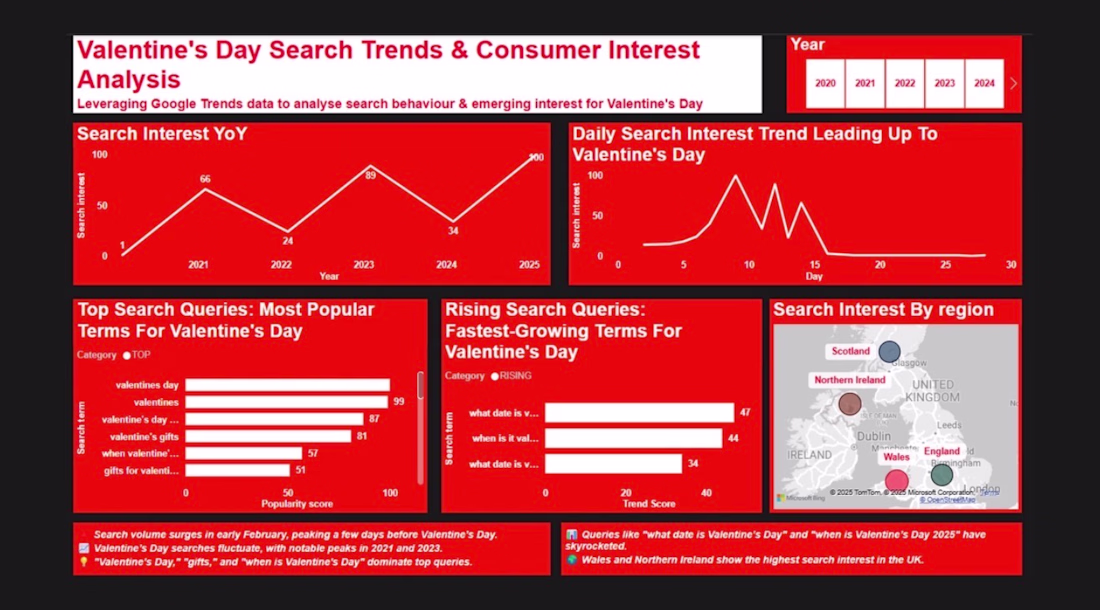
This Power BI dashboard uses Google Trends data to show how people search around Valentine’s Day ,when interest starts building, what they’re looking for, and which parts of the UK care the most. It turns five years of search behaviour into a clear picture businesses can use to time their campaigns and product pushes.
Key Goals:
Spot when Valentine’s Day interest peaks each year, so campaigns launch at the right moment
Reveal the most popular and fastest-rising searches, showing what shoppers actually want
Map interest across UK regions to show where demand is strongest
The network for creativity
Join 1.25M professional creatives like you
Connect with clients, get discovered, and run your business 100% commission-free
Creatives on Contra have earned over $150M and we are just getting started
Related posts
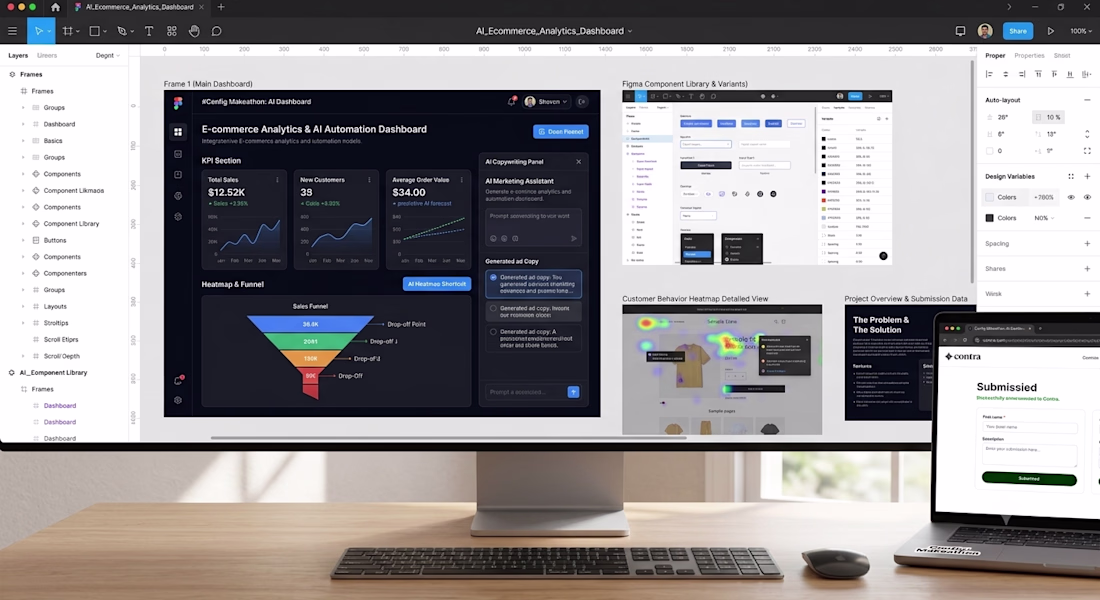
AI-Powered E-Commerce Analytics & Automation Dashboard – Built in Figma
Hi Config Makeathon Team & Judges,
I am thrilled to submit my project for the #ConfigMakeathon. This is a next-generation AI-Powered E-Commerce Dashboard designed entirely in Figma, leveraging the latest Figma UI/UX standards, auto-layout, and components.
🚀 The core problem it solves:
Modern e-commerce store owners (especially Shopify users) struggle to analyze customer behavior, track sales funnels, and generate marketing copies simultaneously. This dashboard solves that by combining analytics with real-time AI assistance inside one clean interface.
✨ Key Features Designed:
Predictive Sales Analytics: Clean charts showing revenue, conversion rates, and bounce rates.
AI Copywriting Assistant Window: An integrated AI tool panel that helps merchants generate Facebook/Google ad copies based on store data.
Customer Behavior Heatmap Shortcut: A fast, intuitive way to see where users click the most.
100% Responsive Design: Fully optimized with Figma’s advanced auto-layout for both desktop and tablet screens.
🛠️ Tools Used:
Figma (Components, Variants, Auto-Layout 5.0, and Variables)
Figma AI capabilities for layout structuring inspiration.
configmakeathonFigmadashboarddesignResponsive DesignProduct DesignUX DesignFigma Makestyled-components
I want to create this really cool local dashboard that would have true meaning and purpose for residents of Pompano Beach.
I recorded a Tella to explain with examples, which I sent to a few people, but I'm waiting to hear back.
If there are any devs, vibe coders or techies or just someone not a writer like me, lol, could tell me who I need (skillset wise) and if they have any recommendations -- affordable and efficient -- this is an MVP. :))) And this is not something I'll profit off of btw. :)
Please message me if you don't mind watching my video and guiding me in the right direction. I'm pretty psyched about it. :D
Link to Video >
tella.tv
Project Request: Build me an election dashboard for upcoming local commission election. — Tella
I’m looking for help in developing a strategic plan (execution mainly) for an upcoming local commissioner election in Pompano Beach, Florida.
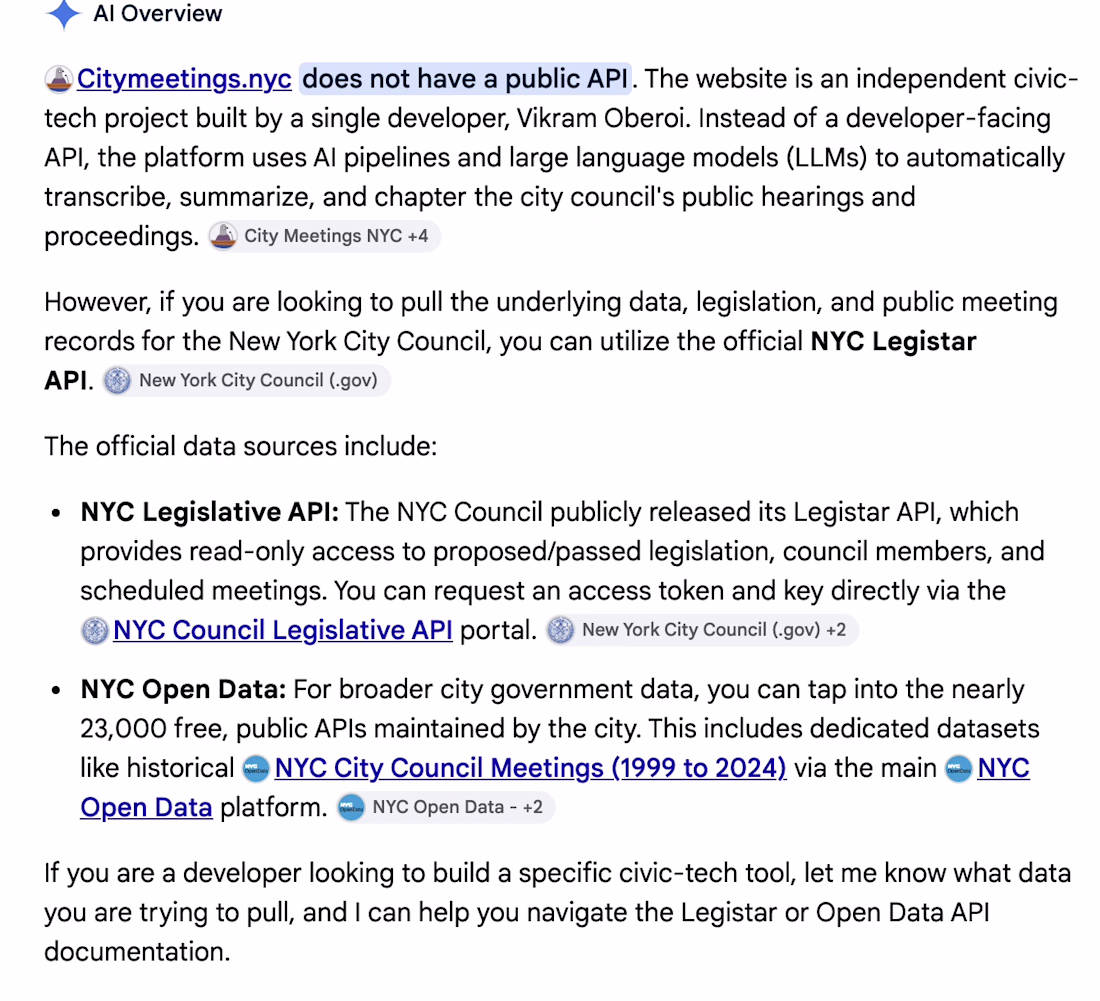
citymeetings.nyc is similar, and this is how they did it.
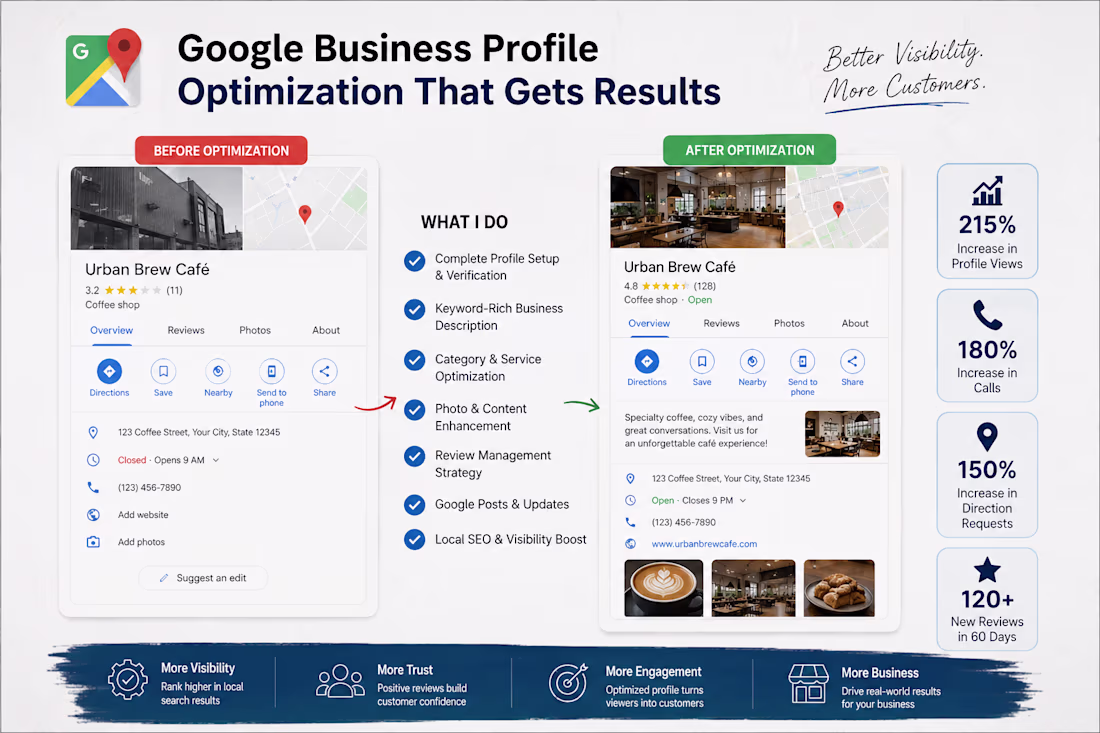
Grow Your Local Business with an Optimized Google Business Profile
Your customers are searching for businesses like yours every day on Google. An optimized Google Business Profile can help you:
* Appear in local search results
* Increase call and website visit
* Get more customer reviews
* Improve trust and credibility
* Attract nearby customers
I help businesses set up, optimize, and manage their Google Business Profiles to maximize local visibility and generate more leads.
Let's turn searches into customer.
Challenges
View allTrending
Claude
Claude has entered the design space. How are you using Claude Design?
Contra University
Learn from expert creatives how to earn more using next-gen AI tools.
MagicPath
The canvas is infinite, and exploration is becoming the workflow. How are you using MagicPath?
creativeaiflow
Creative AI workflows are evolving. What tools do you use, and what are their strengths and weaknesses?
freelancerlife
Freelancer life is wins, pivots, and everything in between. What’s yours right now?