The network for creativity
Join 1.25M professional creatives like you
Connect with clients, get discovered, and run your business 100% commission-free
Creatives on Contra have earned over $150M and we are just getting started
Back to feedPost

Advanced Amazon PPC Insight:
One of the most misleading metrics in PPC is “good ACOS” without impression share context.
A campaign can show:
• Strong ROAS
• Low ACOS
• High CVR
…while still underperforming at account level.
Why?
Because many campaigns are optimized only for efficiency, not market capture.
If your bids become too conservative, Amazon’s algorithm may keep serving ads only in the highest-converting situations:
• Branded traffic
• Bottom-of-funnel shoppers
• Exact high-intent searches
• Retargeting-like placements
Result?
Your efficiency improves… but your visibility footprint shrinks.
This creates a dangerous illusion:
The campaign looks healthier while total demand capture declines.
In mature accounts, growth often comes from understanding:
“How much profitable traffic are we NOT reaching?”
The real optimization layer is balancing:
• Conversion efficiency
with
• Search visibility expansion
That’s why advanced PPC management is not just bid optimization.
It is impression distribution management across:
• Match types
• Placement layers
• Search intent stages
• Budget priority
• Query mining depth
• Lifecycle positioning
Sometimes increasing ACOS slightly can increase total profitable market share significantly.
Efficiency metrics alone rarely tell the full story.
#AmazonPPC #AmazonAdvertising #EcommerceGrowth #AmazonSeller #PPCStrategy #DigitalMarketing #SponsoredProducts #AmazonFBA
The network for creativity
Join 1.25M professional creatives like you
Connect with clients, get discovered, and run your business 100% commission-free
Creatives on Contra have earned over $150M and we are just getting started

Challenges
View all


Related posts

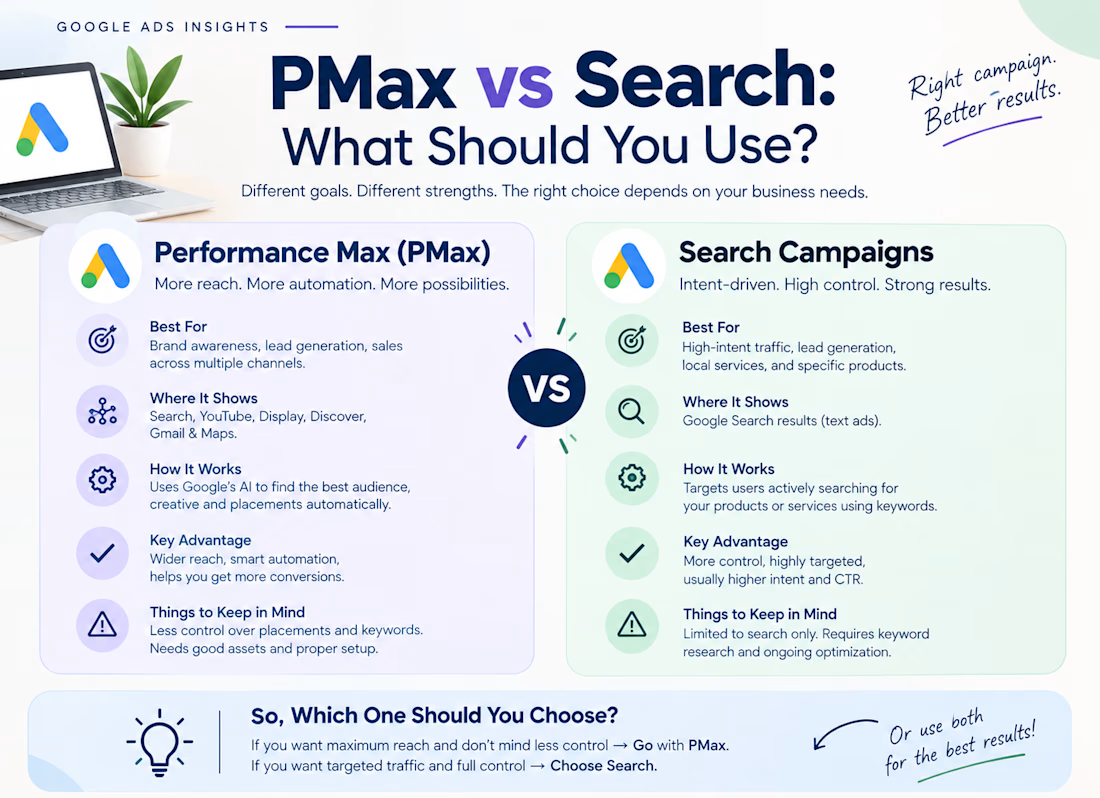
🚀 PMax vs Search: What Should You Use?
A common question I hear:
“Should I run Performance Max or Search campaigns?”
The answer depends on your business goal, audience, and campaign data.
🔎 Search Ads
Best when you want to target people actively searching for specific products or services.
✅ More control over keywords
✅ Strong search intent
✅ Useful for capturing demand
✅ Easier to understand search-based performance
🤖 Performance Max
Best when you want Google to use automation across multiple Google channels and optimize toward your conversion goals.
✅ Automated bidding & targeting
✅ Access to multiple Google placements
✅ Useful for eCommerce and conversion-focused campaigns
✅ Can help scale when you have enough quality conversion data
💡 The key isn't choosing one simply because it's popular.
Start with your business objective, conversion tracking, budget, and available data—then choose the campaign structure that fits.
Don’t choose the campaign type first. Choose the strategy first.
📩 Need help planning or optimizing your Google Ads campaigns? Let’s connect.
#GoogleAds #PerformanceMax #PMax #SearchAds #GoogleAdvertising #PPC #DigitalMarketing #AdOptimization #PerformanceMarketing

Shopify Analytics will happily tell you revenue and ROAS. It will not tell you if you actually made money after COGS, fees, shipping, returns, and ad spend.
That gap is why I built True Profit Analytics under Reiwa Dev.
You set COGS and costs, import ad spend via CSV, then get a Founder view (P&L waterfall, CM1 to CM2 to net) and an Ads Manager view (POAS and campaign spend). Action cards flag the leaks. You can annotate Shopify Analytics events and export CSV when you need to show someone else the numbers.
Lift adds MCP so Claude, ChatGPT, Cursor, and similar tools can query those Founder and Ads dashboards instead of you screenshotting charts into a chat.
I built it because too many Shopify brands I work with celebrate ROAS while the bank account disagrees. If you only look at top-line vanity metrics, you optimise the wrong thing.
Starts at $12.49/month with a trial. If you run paid ads on Shopify and still argue with your own profit numbers, try it and tell me what is missing.

apps.shopify.com
RWA: True Profit Analytics - True profit after COGS, fees & ads - not vanity... | Shopify App Store
Track true net profit and contribution margin after COGS, fees, and ads. Founder & Ads dashboards, CSV exports, and Lift MCP for AI.

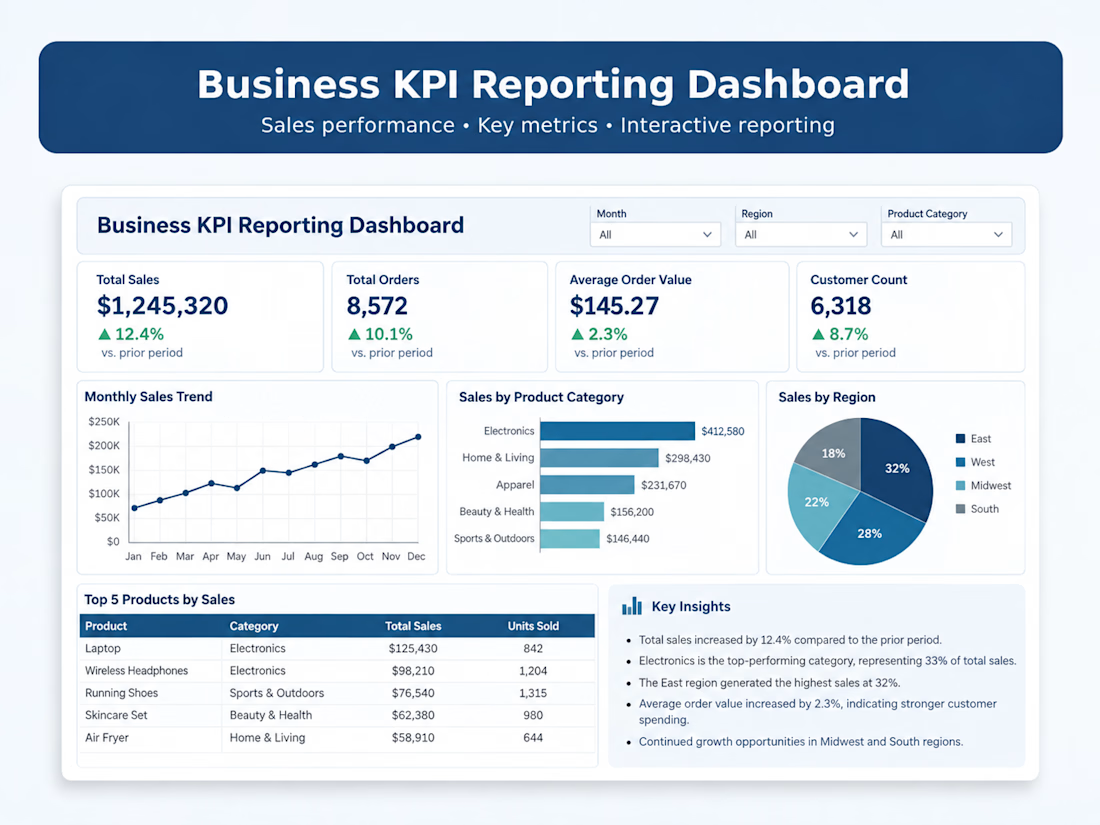
Built a business KPI reporting dashboard using synthetic sales and operations data to demonstrate performance tracking, trend analysis, and executive reporting. The dashboard highlights key metrics including total sales, order volume, average order value, customer activity, product performance, and regional trends.
I organized the data into clear visual summaries designed to help stakeholders quickly identify performance changes, top-performing areas, and opportunities for improvement. This self-directed project demonstrates my approach to turning raw business data into practical, decision-ready reporting.
Tools/skills: Excel, KPI reporting, data visualization, trend analysis, business reporting, and performance analysis.