The network for creativity
Join 1.25M professional creatives like you
Connect with clients, get discovered, and run your business 100% commission-free
Creatives on Contra have earned over $150M and we are just getting started
Back to feedPost

Overview:
This project is an end-to-end Business Intelligence solution that transforms 100 SKUs of raw supply chain data into a high-level strategic tool. It was born out of a "messy land" phase where I had to backtrack to MySQL and Excel to resolve encoding errors and data-type conflicts before building a responsive, three-page executive dashboard in Power BI.
The Three Pillars of the Dashboard:
Slide 1: Executive Financial Overview
Focus: Core profitability and top-line metrics.
The Big Win: I developed custom DAX measures for Net Profit and Revenue generated, identifying Skincare as the primary profit engine ($217,242). This slide serves as the "Financial Pulse" of the company.
Slide 2: Customer & Market Intelligence
Focus: Demographic spending and regional logistics.
The Big Win: By mapping revenue against location and demographics, I identified that Kolkata is our highest-volume market but suffers from a 19.4-day delivery delay. I proposed a logistics shift based on Delhi's faster 14.6-day model to unlock growth.
Slide 3: Supplier Risk & Quality Audit
Focus: Partner performance and manufacturing health.
The Big Win: This is the "Risk" engine. I uncovered a massive liability with Supplier 4, who carries the highest manufacturing costs ($62.71) but holds a 0% inspection pass rate. This provides an immediate, data-backed recommendation for procurement offboarding.
Technical Execution:
Data Engineering: Used MySQL to sanitize product types and create a math-ready schema, overcoming "Incorrect DECIMAL" errors that initially broke the responsiveness of the dashboard.
Advanced Analytics: Built a Weighted Defect Rate measure to identify quality outliers and a Product Affinity Heatmap to show which demographics buy which products.
UI/UX Design: Implemented a futuristic "Dark Mode" theme with neon accents and interactive slicers to allow executives to drill down into specific categories or regions instantly.
The "Jump":
This work represents a move beyond simple data reporting. It demonstrates the ability to audit one's own errors, go back to the source code to fix them, and deliver a "bulletproof" product that connects backend logistics to front-end profit.


The network for creativity
Join 1.25M professional creatives like you
Connect with clients, get discovered, and run your business 100% commission-free
Creatives on Contra have earned over $150M and we are just getting started







Related posts

Most people set a budget once and forget it exists until it's too late.
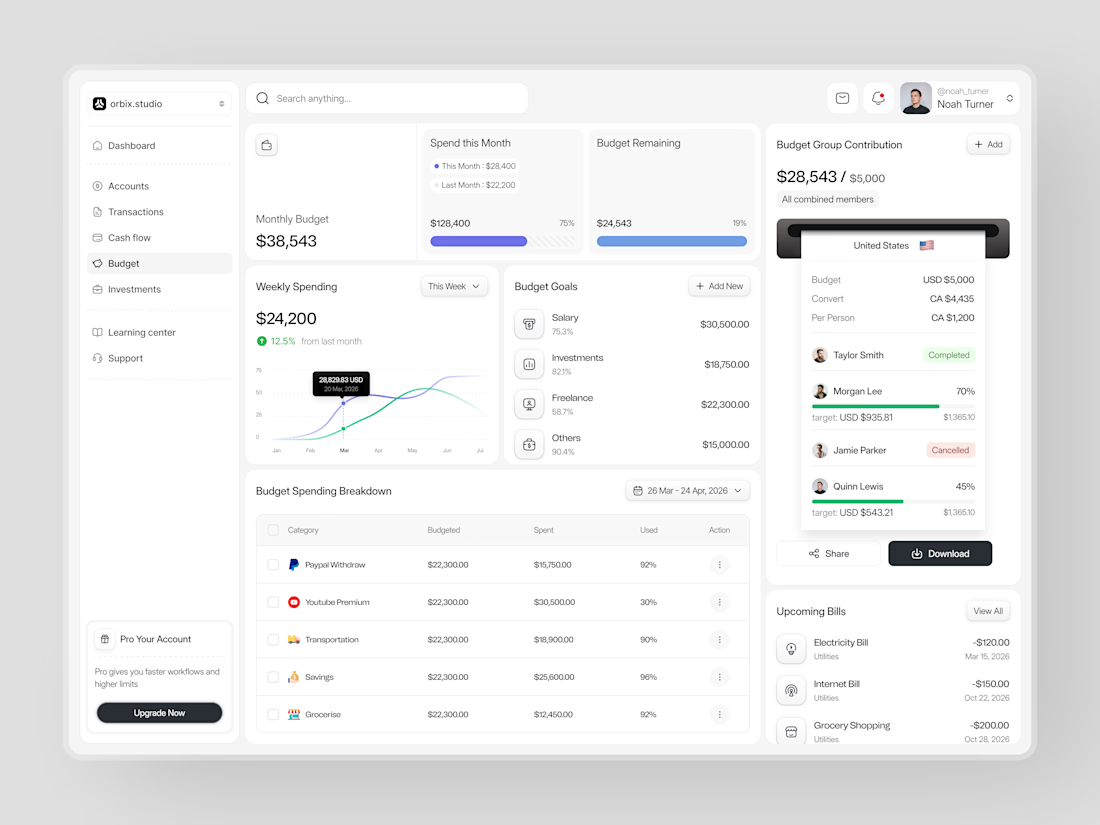
This dashboard was designed to fix that. Weekly spending at $24,200, up 12.5% from last month. Monthly budget at $38,543 with 75% already allocated. Budget goals tracked by category salary, investments, freelance, and others each with a completion percentage and a dollar target that makes progress visible before the month ends.
The group contribution panel takes it further. Four members. One shared budget of $5,000. Taylor completed. Morgan at 70%. Quinn at 45%. Jamie cancelled. A collaborative finance tool that makes shared budgeting feel as clean as personal budgeting should.
Upcoming bills electricity, internet, grocery listed before they hit. A spending breakdown table that shows exactly what was budgeted, what was spent, and how much is left in every category.
This is what budget management looks like when the design treats users like they actually want to be in control of their money.
Does this feel like a dashboard that would change how a team manages their finances together? 👇
Designed by Orbix Studio
Tools: Figma
#DashboardDesign #FintechUI #BudgetApp #UIDesign #WebDesign #ContraFreelance #ProductDesign #SaaSUI


This caught my attention immediately. Great use of contrast and visual hierarchy.

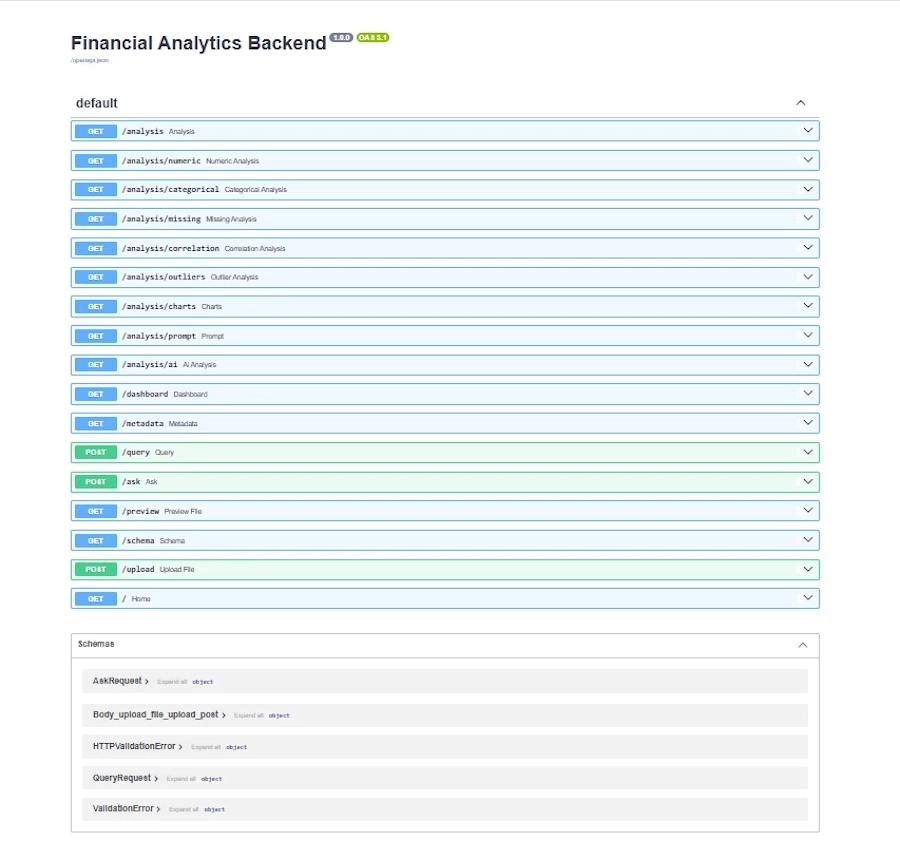
AI-powered financial analytics platform built with FastAPI, Pandas, DuckDB, and Gemini API for data analysis, REST APIs, natural-language-to-SQL queries, and automated business insights.



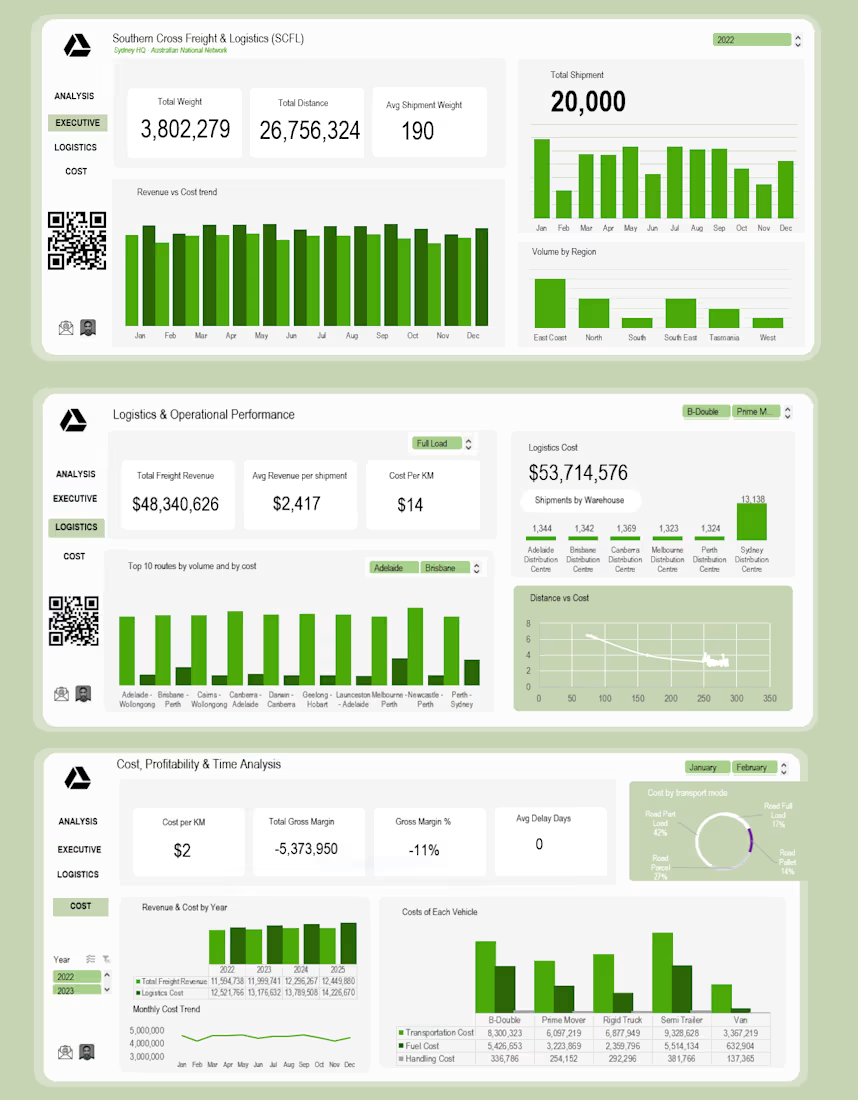
SCFL Executive & Logistics Performance Dashboard
This interactive BI dashboard was built to give the executive team at Southern Cross Freight & Logistics (SCFL) a 360-degree view of their Australian operations. The goal was to move away from static monthly reports and provide a dynamic tool to monitor revenue vs. cost, operational bottlenecks, and fleet profitability.