The network for creativity
Join 1.25M professional creatives like you
Connect with clients, get discovered, and run your business 100% commission-free
Creatives on Contra have earned over $150M and we are just getting started
Back to feedPost

Automated OpenNebula Monitoring and Alerting Architecture
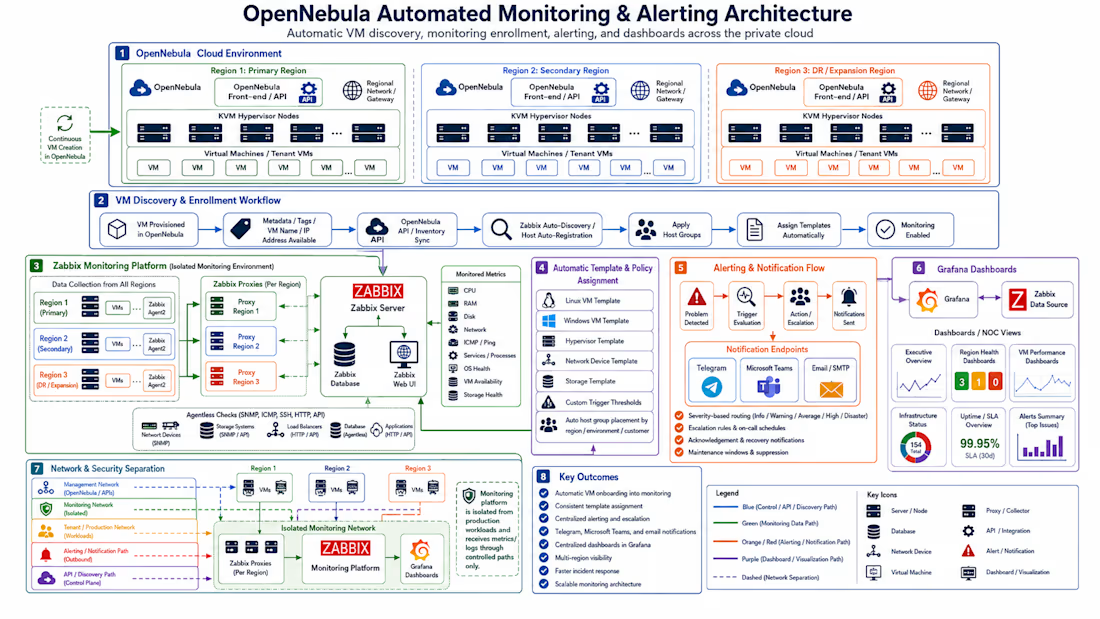
Designed an automated monitoring and observability architecture for a multi-region OpenNebula private cloud environment.
The solution automatically discovers newly created virtual machines through the OpenNebula API and registers them in Zabbix without requiring manual monitoring configuration. Once a VM is detected, it is assigned to the appropriate host group based on its region, environment, operating system, or customer.
Monitoring templates are then applied automatically for Linux, Windows, hypervisor, network, and storage systems. This ensures that every newly provisioned VM receives consistent monitoring, trigger thresholds, availability checks, and alerting policies from the moment it becomes active.
The architecture includes regional Zabbix proxies that collect monitoring data from each OpenNebula region and securely forward it to a centralized Zabbix Server. This reduces cross-region monitoring traffic and allows monitoring to continue locally during temporary network interruptions.
The platform monitors:
CPU and memory utilization
Disk capacity and performance
Network traffic and packet loss
Operating system availability
Services and running processes
VM uptime and availability
Hypervisor health
Storage availability and performance
Network devices using SNMP
Web services and APIs using HTTP checks
When a problem is detected, Zabbix evaluates the configured trigger and escalation policy. Notifications are then automatically routed to Telegram, Microsoft Teams, and email based on severity, environment, and operational responsibility.
Grafana is integrated with Zabbix as a centralized visualization platform. It provides real-time dashboards for infrastructure health, regional availability, VM performance, uptime, service-level objectives, resource capacity, and active alerts.
The monitoring environment is isolated from tenant and production networks using a dedicated monitoring network. Only controlled monitoring, API, and notification traffic is permitted between the cloud regions and the monitoring platform.
Key outcomes of the solution include:
Automatic VM discovery and monitoring enrollment
Consistent monitoring across all OpenNebula regions
Automated template and policy assignment
Centralized alerting and escalation
Telegram, Microsoft Teams, and email notifications
Real-time Grafana dashboards
Reduced manual administration
Faster incident detection and response
Scalable monitoring for future cloud expansion
This project demonstrates my ability to integrate OpenNebula, Zabbix, Grafana, API-driven automation, multi-region monitoring, centralized alerting, and secure network segmentation into a complete private cloud observability platform.


The network for creativity
Join 1.25M professional creatives like you
Connect with clients, get discovered, and run your business 100% commission-free
Creatives on Contra have earned over $150M and we are just getting started





Related posts

Prometheus high-cardinality explosion: The hidden telemetry trap that crashes your monitoring cluster precisely when a production incident occurs.
Prometheus and Grafana are the gold standard for production monitoring. Yet almost every scaling engineering organization eventually watches their central Prometheus instance crash with an Out-Of-Memory (OOM) error right in the middle of a high-traffic launch or outage.
The culprit is almost never data volume; it is **uncontrolled label cardinality**.
Here is the exact mechanics of a cardinality collapse:
1. The Unsanitized Label Injection: A developer instruments an API metric: ``http_requests_total{method="POST", path="/api/v1/users/12345/checkout"}``. Instead of grouping by the parameterized route template (``/api/v1/users/:id/checkout``), the raw user ID or transaction UUID is injected into the label. 2. The TSDB Index Churn: In Prometheus's Time-Series Database (TSDB), every unique combination of key-value label pairs creates an entirely new time-series stream. 50,000 unique customer IDs mean 50,000 separate in-memory series heads. 3. The Memory Avalanche: Prometheus maintains an in-memory inverted index of all active series. RAM consumption jumps from 4GB to 32GB in minutes. Compaction fails, WAL (Write-Ahead Log) replays stall on restart, and the entire monitoring node falls into an infinite crash loop.
Engineering a resilient, enterprise observability architecture requires proactive cardinality governance: • Aggressive Metric Relabeling: Use Prometheus ``metric_relabel_configs`` to drop high-cardinality label keys at scrape time before they ever enter the TSDB head block. • Parameterized Path Normalization: Enforce strict application-level middleware that normalizes dynamic URL paths and masks user identifiers before exposing ``/metrics``. • Pre-Aggregating Recording Rules: Calculate expensive rate and histogram metrics (e.g. 5-minute request rates) via recording rules, allowing high-frequency dashboards to query pre-computed series rather than millions of raw samples. • Horizontal Long-Term Storage with Thanos: Decouple real-time monitoring from historical retention. Use lightweight Prometheus sidecars shipping immutable 2-hour TSDB blocks to sovereign object storage (Ceph/S3), querying decades of telemetry via Thanos Query with zero local memory risk.
Your monitoring system must be the most resilient component in your infrastructure—never the first to crash.
Deploy a production-hardened observability telemetry platform with our 1–2 week Sprint on Contra: https://contra.com/s/r6k2QLPl-production-observability-and-sre-telemetry-platform
#Observability #Prometheus #Grafana #Monitoring #Infrastructure #DevOps #SRE



:Cloud Hybrid POS system software




Great

🔧 Fix, Harden & Scale Broken AI Workflows (Zero Timeouts | Bulletproof Architecture)
Most automation pipelines break the moment production traffic spikes. Brittle webhooks fail, API rate limits crash running flows, and unhandled LLM hallucinations cause silent data corruption across CRMs and databases.
If your team is losing dozens of hours manually auditing failed runs in n8n, Make, or Zapier, you don't need another patchwork fix—you need hardened systems engineering:
Fault-Tolerant Error Handling: Implement deterministic retries, dead-letter queues, and fallbacks so no webhook or payload is ever lost.
Orchestration Upgrades: Refactor fragile linear chains into stateful, modular multi-agent architectures using LangGraph & CrewAI.
Zero-Timeout Infrastructure: Optimize API execution paths, batch requests, and sanitize inputs/outputs to handle high throughput smoothly.
Full Done-For-You Delivery: Save 1,000+ hours/month by converting chaotic manual backend routines into self-healing, automated pipelines.
Stop letting broken runs stall your operations.
Have an existing workflow that keeps timing out, or need a robust custom agent pipeline built from scratch? Send me an inquiry or hire me directly through my profile.