The network for creativity
Join 1.25M professional creatives like you
Connect with clients, get discovered, and run your business 100% commission-free
Creatives on Contra have earned over $150M and we are just getting started
Back to feedPost

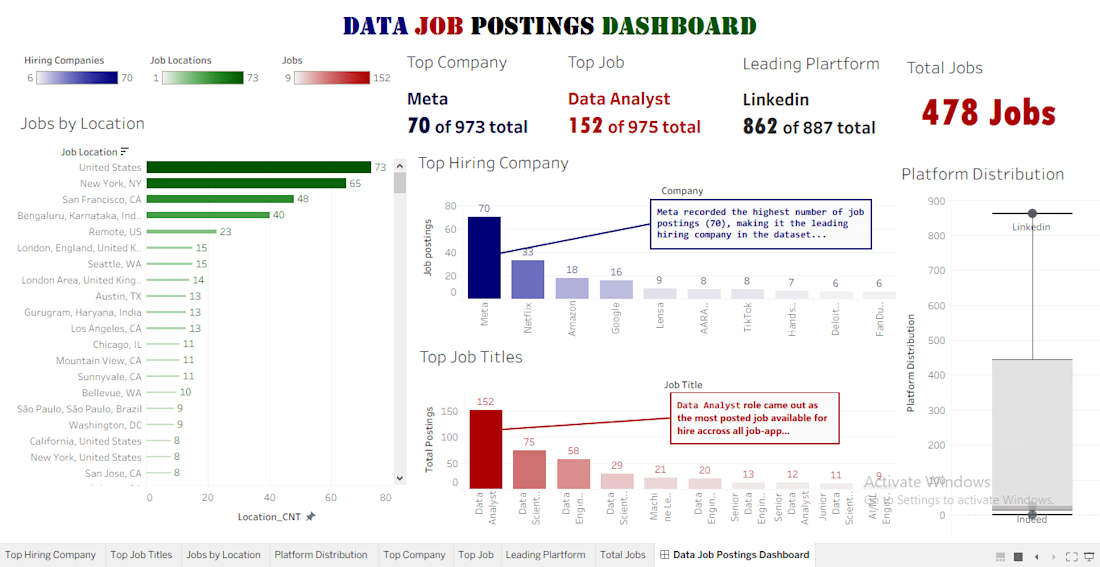
📑Every dataset tells a story. My latest project explores what data job postings can reveal about hiring trends, top employers, and where opportunities are concentrated.
Over the past few days, I worked on an end-to-end analytics project to better understand hiring trends in the data industry using real-world job posting data.
Starting with an unstructured dataset from Kaggle, I transformed it into meaningful business insights through data cleaning, exploratory analysis, and interactive dashboard development.
🛠️ Tools Used
Python (Pandas, NumPy)
Microsoft Excel
Tableau
Git & GitHub
📊 Key Insights
✅ Data Analyst was the most frequently advertised role in the dataset.
✅ Meta recorded the highest number of job postings among all companies analyzed.
✅ LinkedIn was the leading recruitment platform for data-related opportunities.
✅ The United States showed the highest concentration of available data job postings.
📈 Project Workflow
Kaggle Dataset →
Python (Data Cleaning) →
Excel (Validation & Structuring) → Python (EDA) →
Tableau Dashboard →
Business Insights
This project strengthened my skills in:
Data Cleaning
Exploratory Data Analysis (EDA)
Data Visualization
Dashboard Design
Business Storytelling
GitHub Documentation
I'm continuously building my portfolio and improving my ability to turn raw data into actionable insights. I'd love to hear your thoughts or feedback!


The network for creativity
Join 1.25M professional creatives like you
Connect with clients, get discovered, and run your business 100% commission-free
Creatives on Contra have earned over $150M and we are just getting started
Trending
retrofuturism
Share your favorite designs from the past exploring the distant future. Or your own take on the aesthetic 🚀
halftone
Dots. Texture. Grain. Let's see your designs using the halftone technique.

Midjourney
Creatives are showing off what they're making with Midjourney.
colorgrade
Video editors sound off: How do you enhance the mood of your video in color grading?
Related posts

Here is a professional English translation of your post that captures the exact same message and tone:
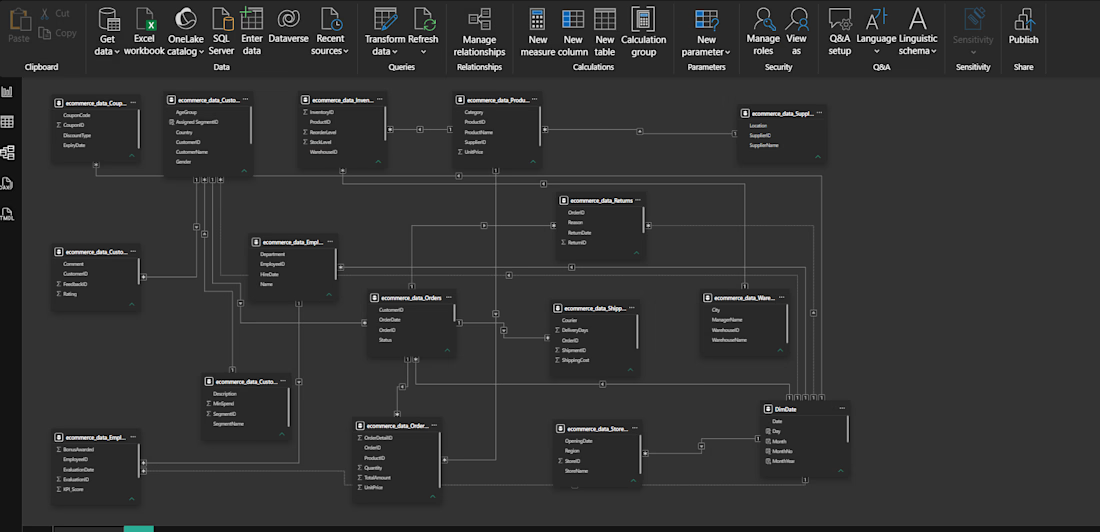
Just wrapped up the project, and I realized this is definitely the picture worth sharing the most! 😁
Sometimes people look at the final dashboard and think that’s where all the work happens, but the real magic starts right here... the Data Model.
Behind every single relationship here is a lot of thinking, testing, and tweaking until everything finally clicked into place.
Alhamdulillah, the project is officially complete, and I’ve learned way more from it than I initially expected.
Any feedback is more than welcome! 🙏
#PowerBI #DataAnalytics #PowerBIDeveloper #Portfolio #OpenToWork



About the Project
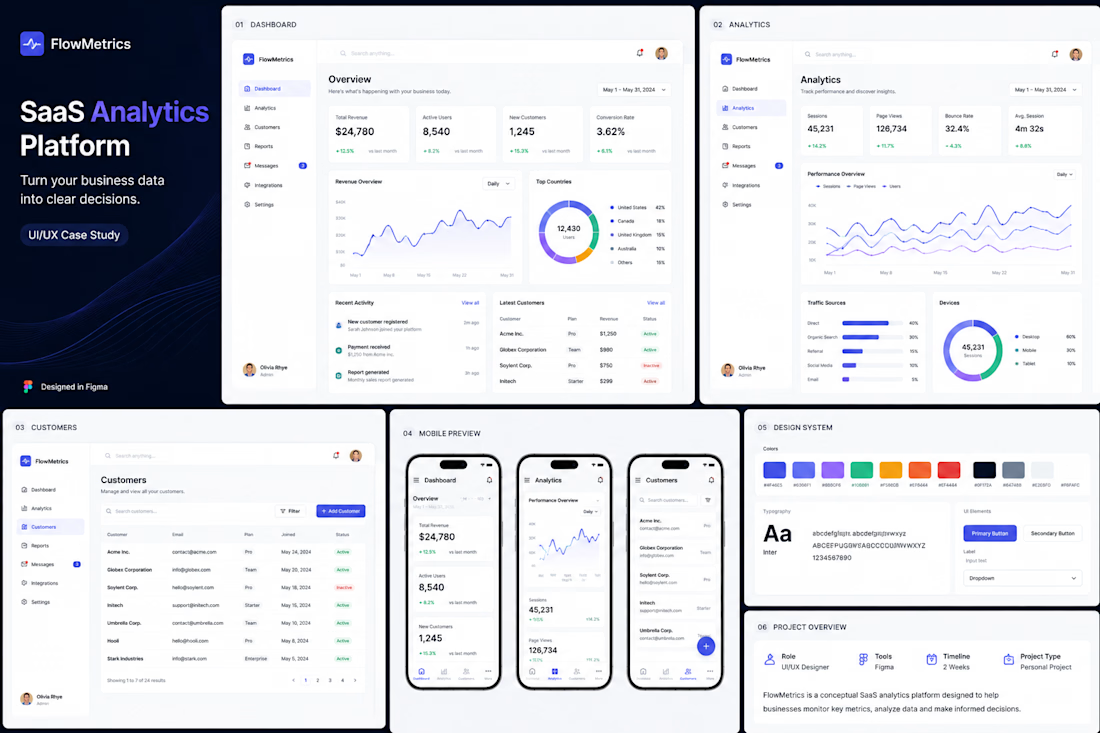
FlowMetrics is a conceptual SaaS analytics platform designed to help businesses monitor performance, understand customer behavior, and make data-driven decisions from one centralized dashboard.
I designed the product experience in Figma, focusing on a clean and intuitive interface that makes complex business data easier to understand. The project includes the main analytics dashboard, customer management, reports, responsive mobile screens, and a reusable design system.


Hi everyone!
I'm new here, so I wanted to introduce myself.
I learned the basics of Python about two years ago, and a year ago I started a degree in AI and Data Science. I'm currently in my third semester, and I'm focused on developing my programming and data skills while building my first real-world experience.
For now, I'm looking to contribute to smaller tasks such as data cleaning, data analysis, automation, and logical scripting. I don't expect to jump directly into complex projects; my goal is to help with the work I can handle while learning how software and data projects actually work in the industry.
I'm also very interested in how AI fits into programming. In my personal projects, I try to use AI primarily as a learning and reasoning tool rather than as a replacement for understanding or writing the code myself. I like using it more as a Socratic teacher: asking questions, challenging my reasoning, explaining concepts, and helping me find mistakes.
At the same time, I recognize that AI is becoming almost indispensable in modern development. But I believe that understanding the fundamentals is just as important. I want to learn how things work, not simply how to get an AI to produce them.
Currently, I'm working on a physics simulator as a personal project. It's still a work in progress, but I hope to share my progress here in the future.
I'm here to learn, contribute, and get a better understanding of what working in the industry is actually like. If there are small tasks where I can be useful while continuing to learn, I'd be happy to help.
Best regards!