The network for creativity
Join 1.25M professional creatives like you
Connect with clients, get discovered, and run your business 100% commission-free
Creatives on Contra have earned over $150M and we are just getting started
Back to feedPost
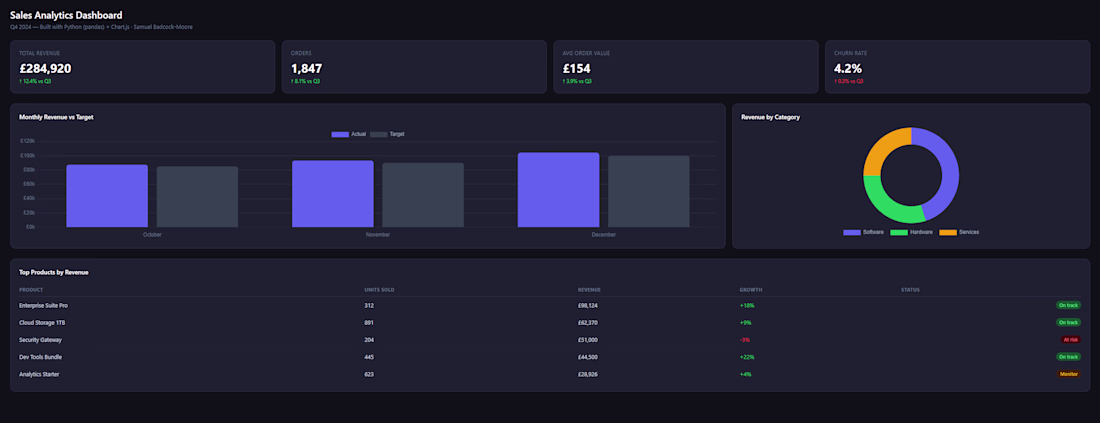
I built this to practice turning raw sales data into something actually useful to look at. It pulls together monthly revenue vs targets, product performance, and key metrics into one dashboard. The kind of thing a business would want at the end of a quarter instead of a spreadsheet full of numbers. Built with JS and Chart.js, based on the same output I'd generate from a pandas pipeline.
The network for creativity
Join 1.25M professional creatives like you
Connect with clients, get discovered, and run your business 100% commission-free
Creatives on Contra have earned over $150M and we are just getting started
Related posts
Building a brand new AI Fintech dashboard components
WIP :)
Cool
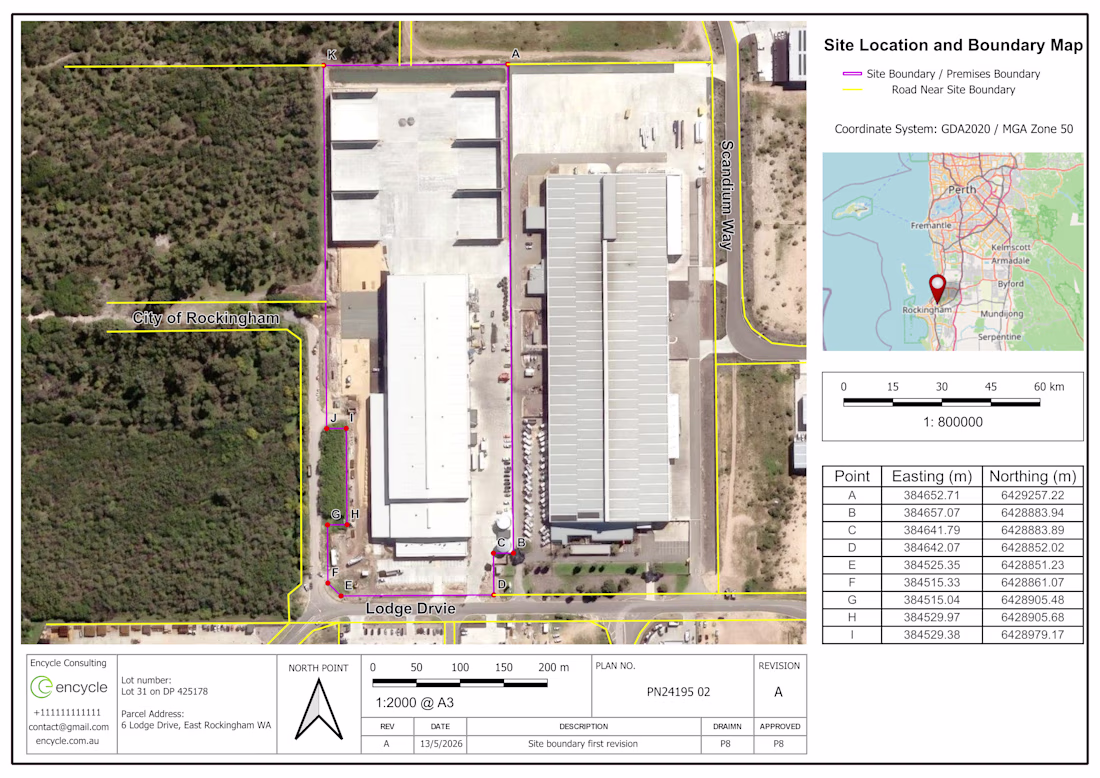
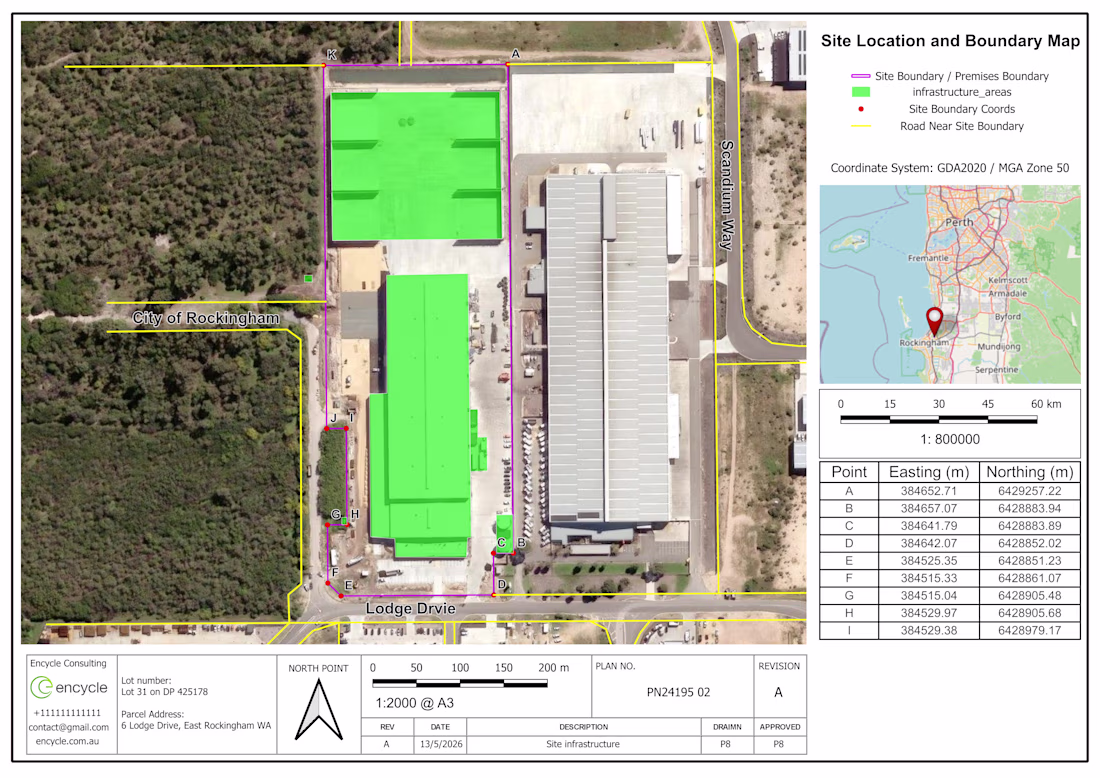
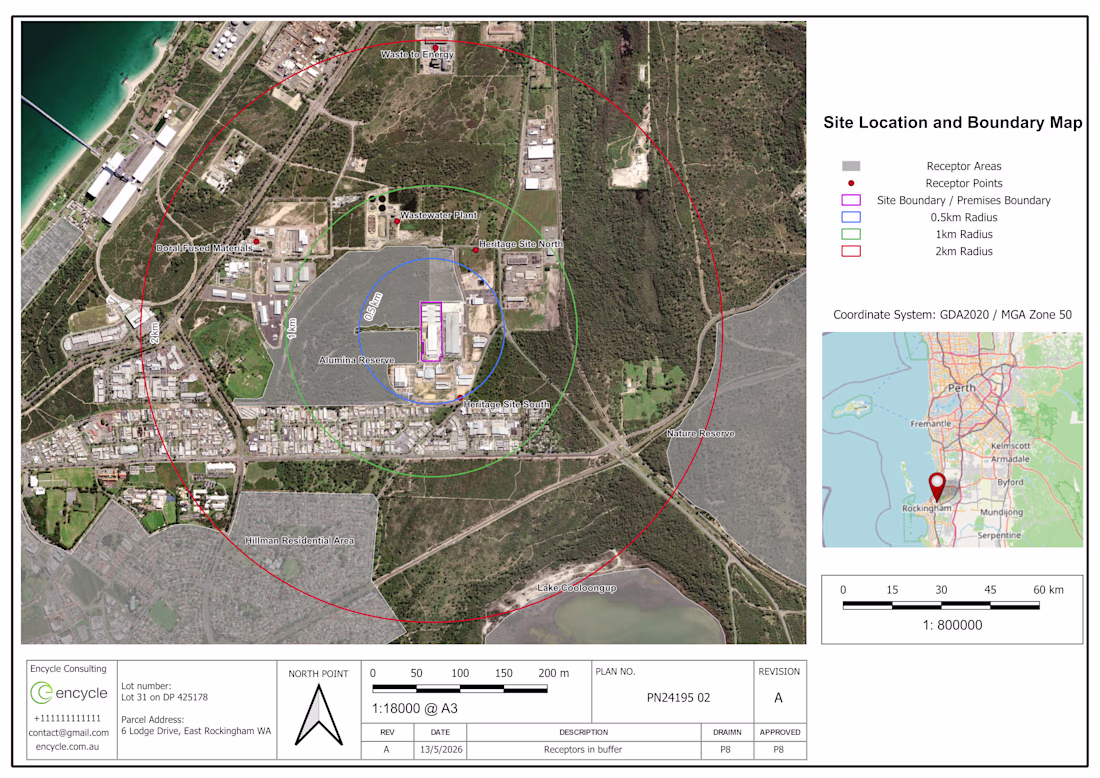
😊 GIS Mapping and Environmental Site Plan Development for Approval Documentation
I developed a professional GIS mapping package for an environmental approval project, including site boundary mapping, receptor buffer analysis, infrastructure marking, coordinate tables, A3 layout design, scale bars, legends, north arrows, and regional location insets. The final outputs were prepared as clear, approval-ready maps using high-resolution aerial imagery and GDA2020 / MGA Zone 50 coordinate reference standards.:
His work so cool!
Trending
Claude
Claude has entered the design space. How are you using Claude Design?
Contra University
Learn from expert creatives how to earn more using next-gen AI tools.
creativeaiflow
Creative AI workflows are evolving. What tools do you use, and what are their strengths and weaknesses?
portfolioreview
The best portfolios tell a story, not just show a grid. Share yours for feedback.
freelancerlife
Freelancer life is wins, pivots, and everything in between. What’s yours right now?