The network for creativity
Join 1.25M professional creatives like you
Connect with clients, get discovered, and run your business 100% commission-free
Creatives on Contra have earned over $150M and we are just getting started
Back to feedPost

A Rs. 85 Cr revenue project-driven built environment business continued growing, but EBITDA declined from 11% to 6% over 3 years.
Leadership initially believed the issue was execution inefficiency.
The deeper review showed something else:
-aggressive pricing approvals without structured thresholds
-inconsistent variation order recovery
-commercial exceptions approved outside defined controls
-estimation assumptions changing during execution
-high dependence on promoter-led deal decisions
The result was predictable:
Revenue scaled faster than commercial discipline.
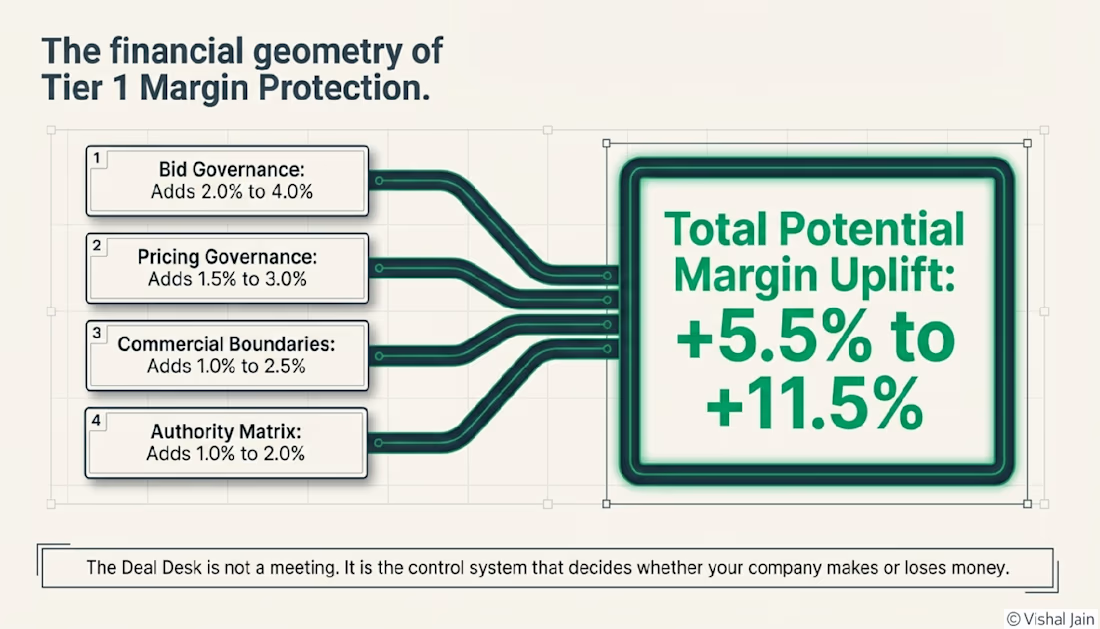
After introducing structured bid governance, pricing controls, authority thresholds, and commercial review mechanisms, margin visibility improved significantly before execution itself began.
In many project businesses, margin erosion starts much earlier than site execution.
The network for creativity
Join 1.25M professional creatives like you
Connect with clients, get discovered, and run your business 100% commission-free
Creatives on Contra have earned over $150M and we are just getting started





Related posts

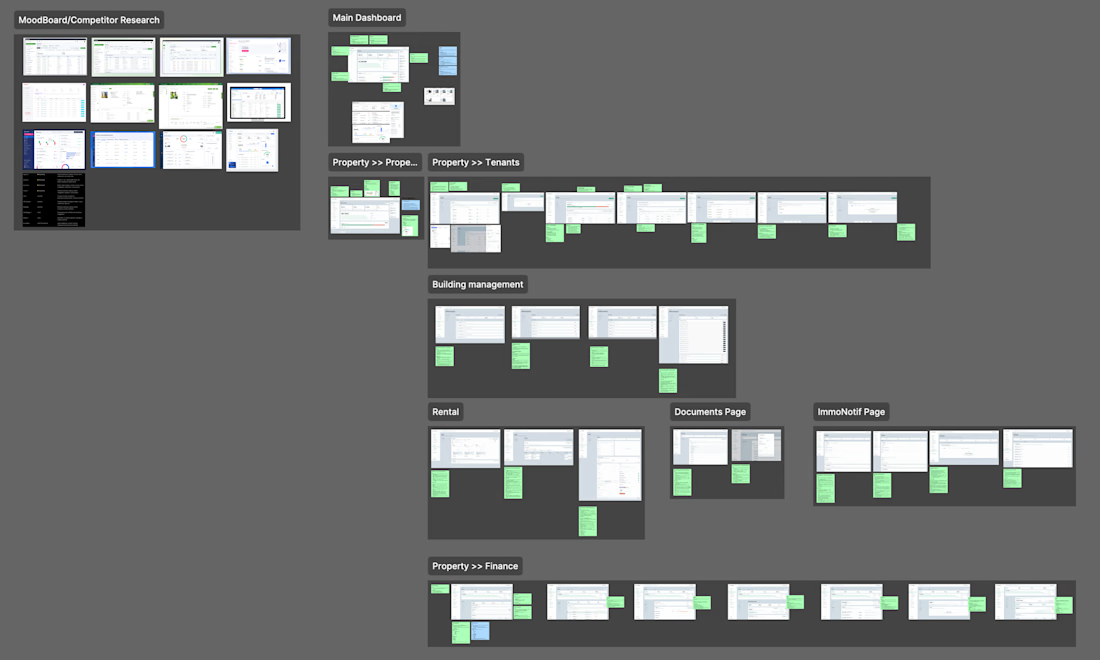
UX Audit: ImmoAdmin (Property Management SaaS)
-> UX issues mapped with improvement notes
-> Competitor research & mood board
-> 8 modules audited screen by screen
-> Wireframes with cleaner flows


Really thoughtful approach to simplifying complex SaaS flows. 👏

Episode 2: Your Numbers Should Make a Sense!
Your sales are growing, but are you actually making more money?
Sales up 40%. Profit down 7%. 😬
Same business, six months later:
Sales: 100K → 140K a month
Profit: 15K → 14K a month
Profit margin: 15% → 10%
More revenue doesn't mean more money. Three things quietly eat the difference:
1️⃣ Margins shrink. Discounts, supplier price rises and delivery costs.
2️⃣ Overheads outgrow sales. Hires, rent and software.
3️⃣ Cash gets stuck. Unpaid invoices and unsold stock.
Track these 3 numbers every month:
✅ Gross margin %
✅ Net profit margin %
✅ Profit vs cash in the bank
Growth without margin is just a busier business.


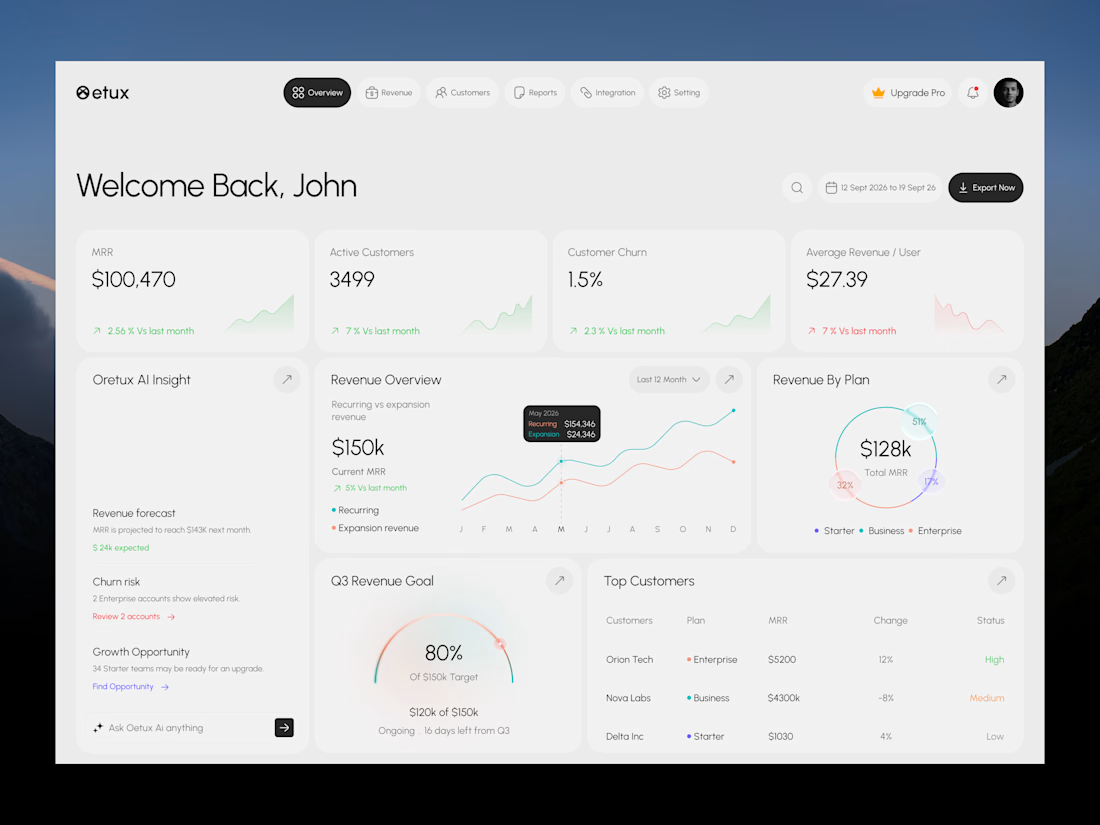
Oetux – SaaS Revenue Analytics Dashboard
The client had a lot of data, but the real problem was making sense of it.
MRR, revenue, churn, active customers, growth, customer performance, goals. Every metric was important, but when everything gets the same attention, users don’t know where to look first.
The existing experience made users spend too much time switching between information and trying to connect the numbers.
So we focused on how SaaS teams actually read their business data. We structured Oetux around the questions that matter most.
How is revenue performing?
Are we growing?
Are customers staying?
Where are we losing revenue?
What needs attention right now?
Then we organized KPIs, revenue trends, customer performance, churn insights, goals, and AI powered insights into one clear experience.
The goal wasn’t to remove data.
It was to organize the data so users could understand it faster.
That’s what we solved with Oetux.
Turning a data heavy SaaS dashboard into an experience that helps teams see their business clearly and make better decisions.


Love the clean layout.