The network for creativity
Join 1.25M professional creatives like you
Connect with clients, get discovered, and run your business 100% commission-free
Creatives on Contra have earned over $150M and we are just getting started
Back to feedPost
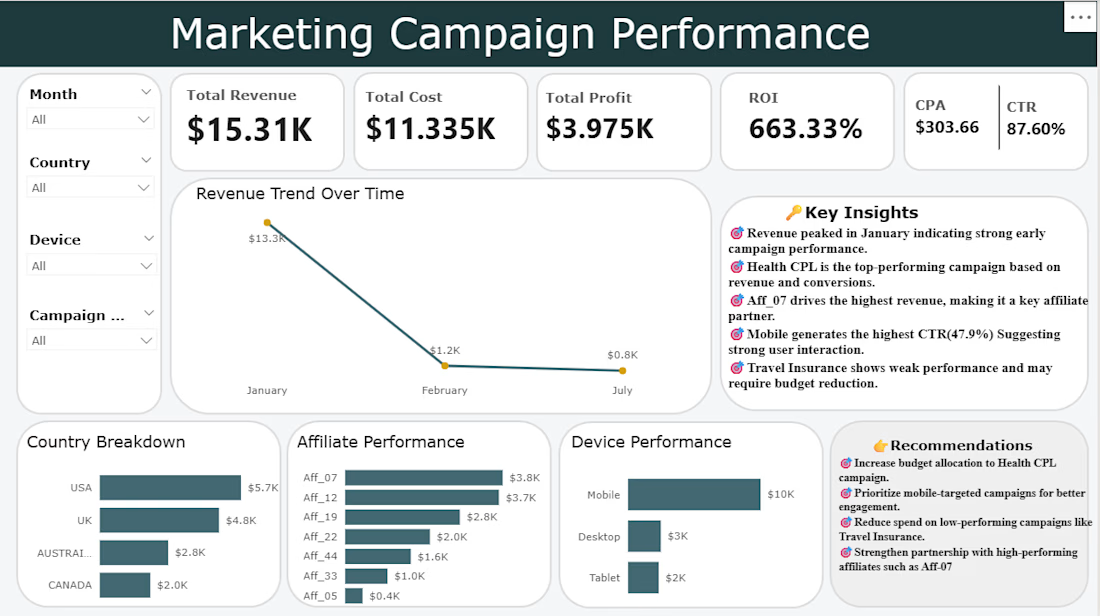
Marketing Campaign Performance Dashboard (Power BI)I built a marketing analytics dashboard in Power BI to track campaign performance across revenue, cost, and engagement.
Key KPIs:
Total Revenue: $15.31K
Total Cost: $11.34K
Total Profit: $3.98K
ROI: 663.33%
CPA: $303.66
CTR: 87.60%
Dashboard features:
Revenue trend analysis (Jan–Jul)
Country performance breakdown (USA leading at $5.7K)
Affiliate performance tracking (top: Aff_07 at $3.8K)
Device analysis (Mobile dominates at $10K)
Interactive slicers (Month, Country, Device, Campaign)
Insights + recommendations panel for decision-making
This project helped me understand how raw marketing data can be transformed into actionable business insights using Power BI.
Open to feedback and improvements.
The network for creativity
Join 1.25M professional creatives like you
Connect with clients, get discovered, and run your business 100% commission-free
Creatives on Contra have earned over $150M and we are just getting started
Related posts
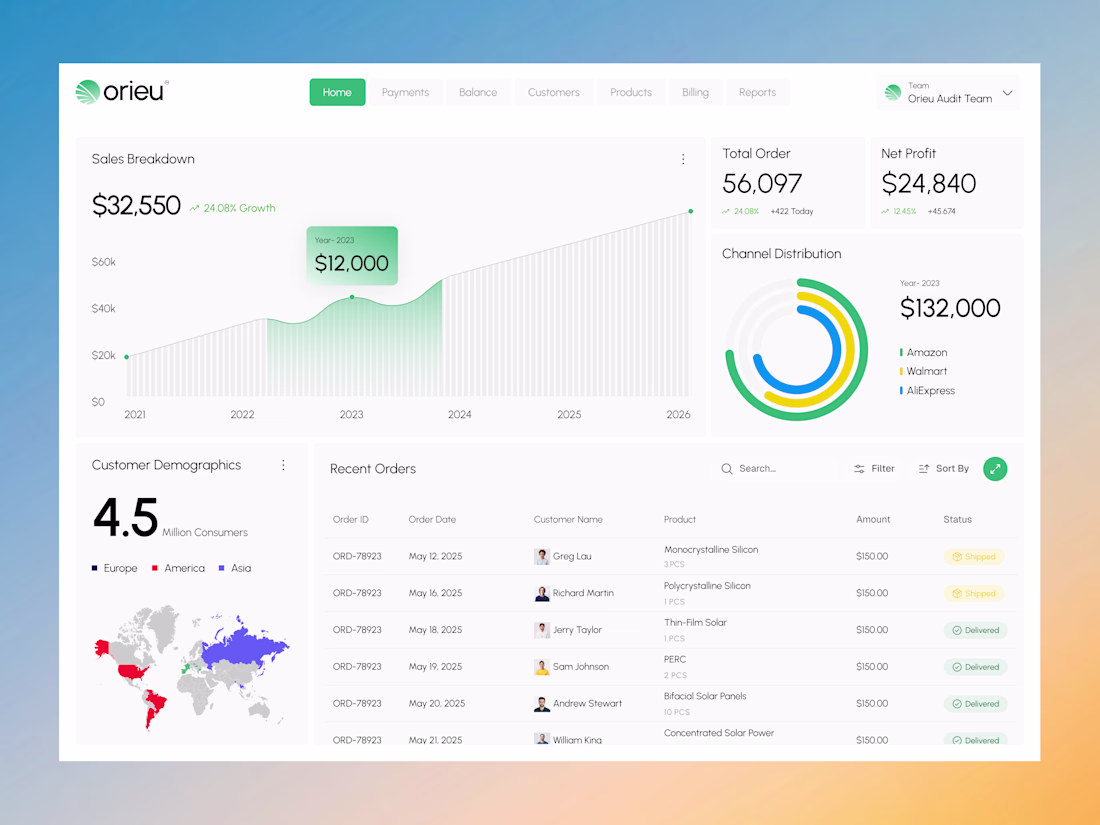
Most dashboards become harder to use as they scale.
Orieu was designed to move in the opposite direction.
A solar sales intelligence dashboard built to simplify how renewable energy businesses track revenue, monitor orders, analyze customer activity, and manage operational performance.
The experience focuses on:
• Clear analytics visualization
• Lightweight navigation
• Structured operational workflows
• Minimal eco-inspired UI
• Faster decision-focused interaction
The challenge wasn’t adding more features.
It was organizing complexity into something users can understand instantly.
Because in SaaS products, usability directly impacts business efficiency.
Currently available for SaaS dashboard, analytics platform, and web app design collaborations. Let’s build a product your users actually enjoy using.
Product DesignUI DesignAdobe PhotoshopFigmaAdobe IllustratordashboarddesignsolarsystemAI VIsual Designersolarenergydesign
Clean 👌🏻
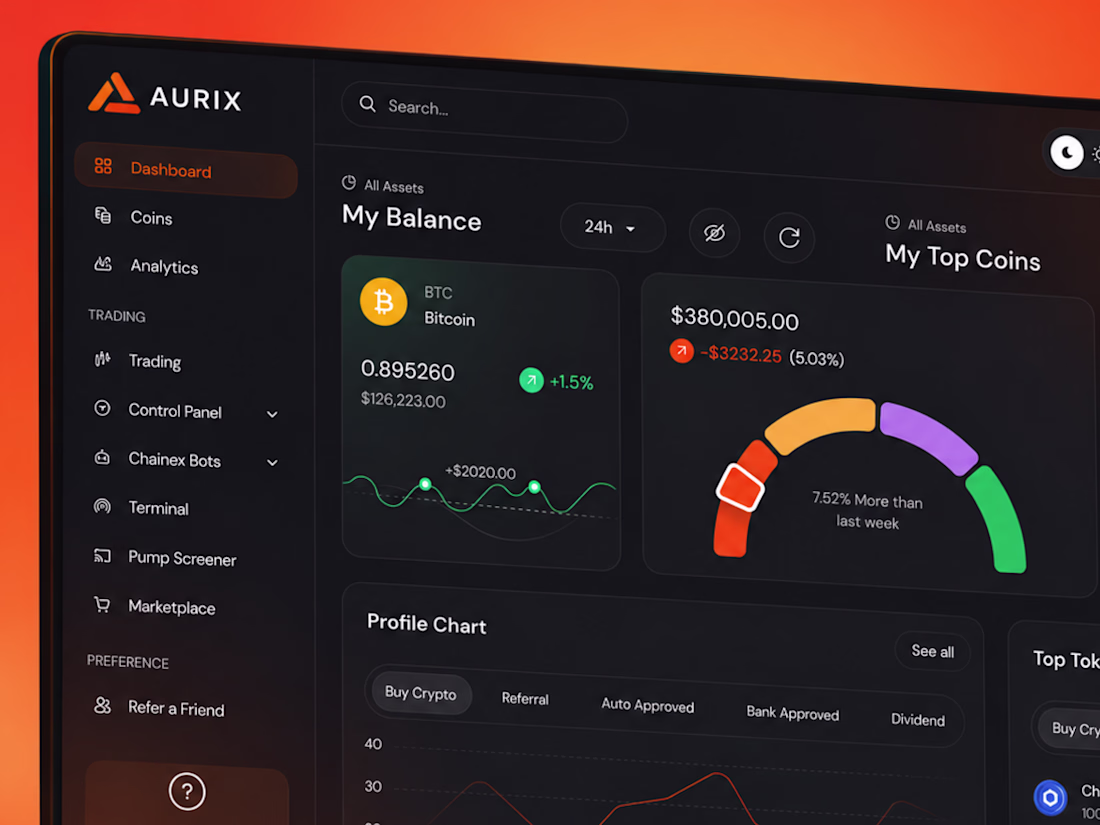
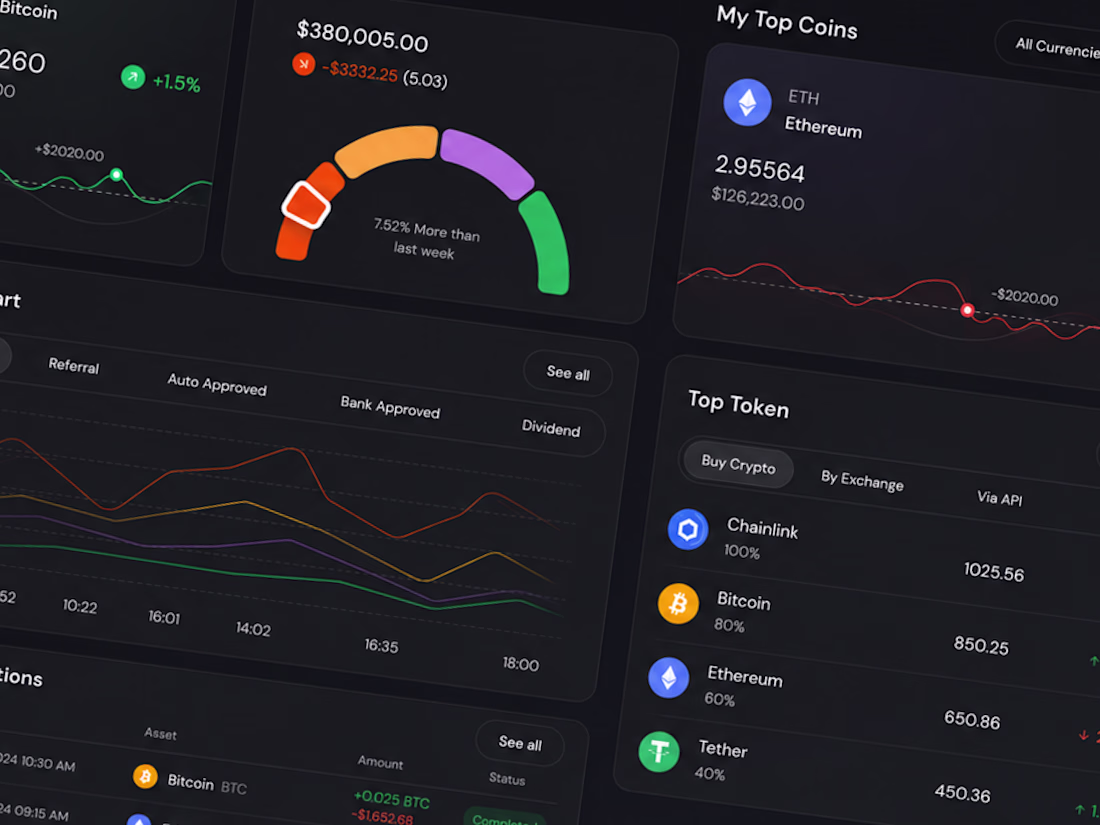
Designed a modern crypto dashboard experience focused on simplicity, clarity, and premium visual aesthetics.
The goal was to transform complex financial data into an intuitive and engaging interface through clean layouts, structured information hierarchy, glowing charts, and smooth dark-theme visuals.
From portfolio tracking and asset management to trading insights and analytics, every section was crafted to feel seamless, modern, and highly interactive. The bold orange gradients combined with minimal UI elements create a futuristic fintech experience that feels both powerful and elegant.
This concept explores how strong visual design and usability can work together to make digital finance platforms more user-friendly and visually immersive.
#CryptoDashboard #DashboardDesign #FintechUI #DarkUI #UIUXDesign #CryptoUI #SaaSDesign #WebAppDesign #ProductDesign #ModernUI #UIDesigner #UXDesign #DataVisualization #TradingPlatform #FigmaDesign #CreativeUI #DigitalProduct #AppDesign #DesignInspiration #BehanceProject
Trending
Claude
Claude has entered the design space. How are you using Claude Design?
Contra University
Learn from expert creatives how to earn more using next-gen AI tools.
creativeaiflow
Creative AI workflows are evolving. What tools do you use, and what are their strengths and weaknesses?
portfolioreview
The best portfolios tell a story, not just show a grid. Share yours for feedback.
freelancerlife
Freelancer life is wins, pivots, and everything in between. What’s yours right now?