The network for creativity
Join 1.25M professional creatives like you
Connect with clients, get discovered, and run your business 100% commission-free
Creatives on Contra have earned over $150M and we are just getting started
Back to feedPost

DataLens — Automated Dataset Health Checker 📊
Stop repeating dataset checks. Start understanding your data.
Every new data project begins with the same routine:
Check missing values. Inspect data types. Find outliers. Explore distributions. Calculate statistics.
You write Python code, run Jupyter Notebook cells, and repeat the process—again and again.
What if you could automate that first step?
Meet DataLens
DataLens is an interactive dataset health-checking platform built to make data inspection faster, simpler, and more actionable.
Instead of manually running the same checks for every dataset, simply upload your file and explore its health report in one place.
🚀 What can you do with DataLens?
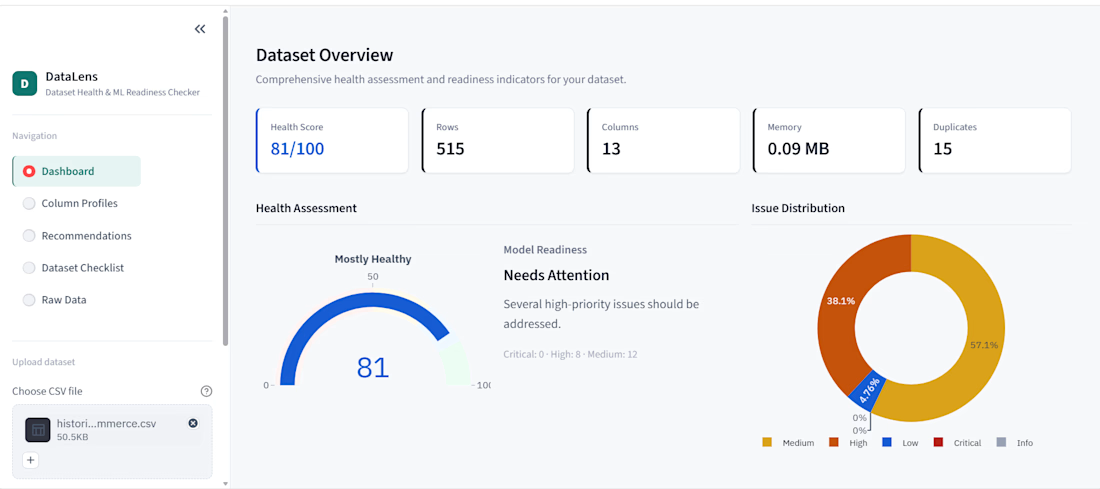
📊 Automated Dataset Overview
Understand your dataset's dimensions, column types, and key statistics at a glance.
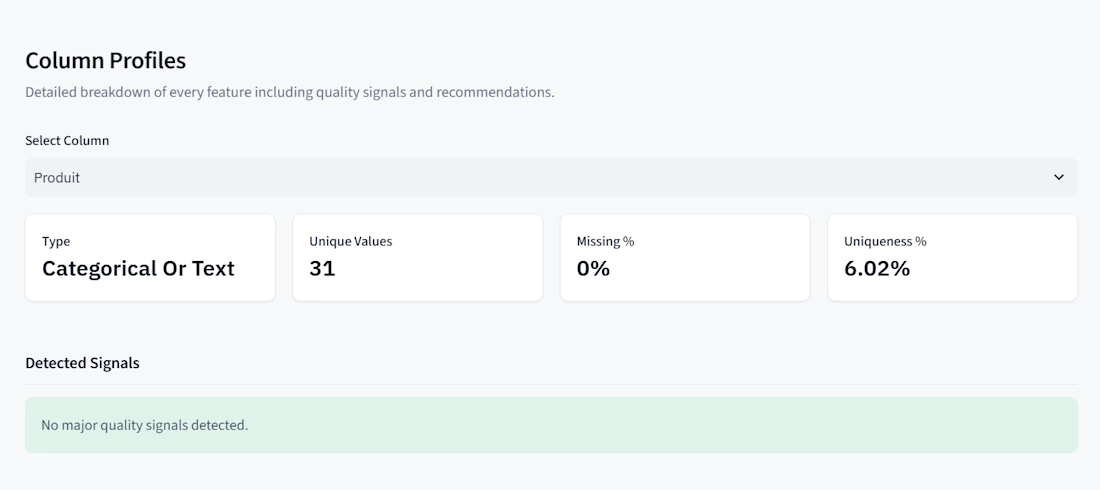
🔎 Detailed Column Profiles
Explore individual features and discover patterns that deserve attention.
⚠️ Data Quality Checks
Identify potential issues such as missing values and outliers before they affect your analysis or ML workflow.
💡 Actionable Recommendations
Get practical suggestions to help guide your data-cleaning and preparation decisions.
📋 Dataset Preparation Checklist
Review important steps before moving forward with your analysis or model training.
🗂️ Raw Data Exploration
Inspect actual dataset records directly within the platform.
Who is DataLens for?
Data Science students
Machine Learning practitioners
Data analysts
Python and Jupyter Notebook users
Anyone who regularly works with new datasets
Why I built it
I wanted to simplify one of the most repetitive parts of data science: the initial dataset inspection.
DataLens helps turn that routine into a structured workflow, so you can spend less time repeating basic checks and more time understanding your data.
It's not about replacing data scientists or eliminating EDA.
It's about making the first step more efficient, organized, and actionable.
🛠️ Built with
Python · Streamlit · Data Analysis
DataLens: Upload your dataset. Discover potential issues. Get recommendations.
Because better data preparation starts with better data understanding.

The network for creativity
Join 1.25M professional creatives like you
Connect with clients, get discovered, and run your business 100% commission-free
Creatives on Contra have earned over $150M and we are just getting started



Related posts

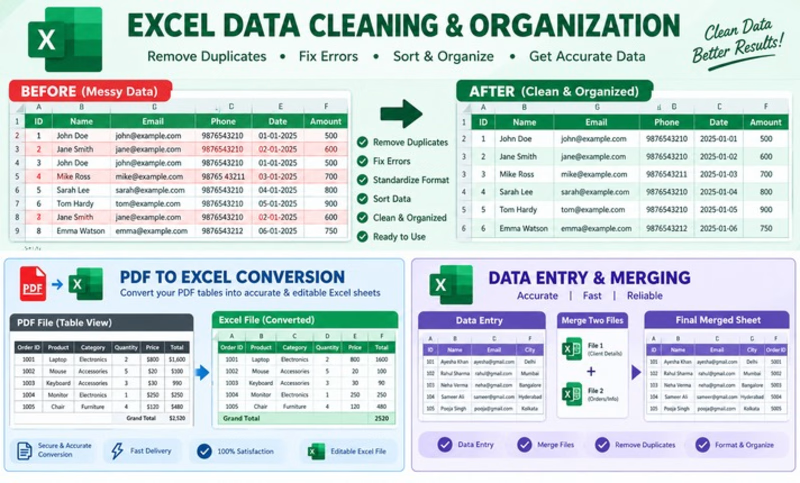
I’m a professional Excel user, helping you with data entry and formatting.



Project Overview
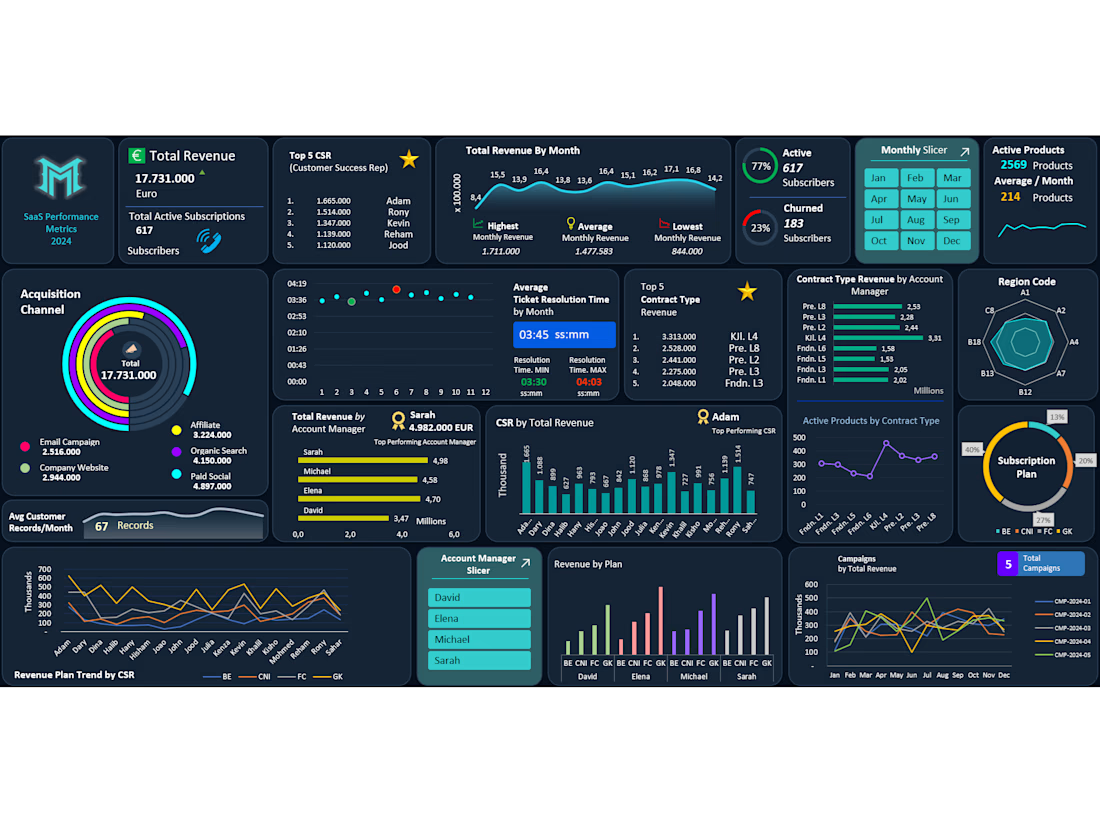
Designed and developed an end-to-end, interactive SaaS Performance Metrics Dashboard to track €17.73M in annual revenue, subscriber retention, acquisition channels, and team performance across 12 months. Built on a robust backend data architecture powered by 23 interconnected Pivot Tables, enabling seamless dynamic filtering via Monthly and Account Manager slicers.
Key Business Metrics & Insights Tracked:
Revenue & Subscription Health: Monitored €17.73M Total Revenue (Peak: €1.71M/month, Avg: €1.48M/month) alongside 617 Active Subscribers (77% retention) vs. 23% Churn rate (183 subscribers) and 2,569 Active Products.
Customer Acquisition Channels: Analyzed ROI across 5 core channels—identifying Paid Social (€4.89M) and Organic Search (€4.15M) as top revenue drivers, followed by Affiliate (€3.22M), Website (€2.94M), and Email Campaigns (€2.51M).
Team & Account Manager Performance: Evaluated individual contributions, highlighting top-performing Account Manager (Sarah – €4.98M) and Top 5 Customer Success Representatives (CSR Leader: Adam – €1.66M).
Operational Efficiency & SLA: Tracked monthly Average Ticket Resolution Time (03:45 min avg, ranging from 03:30 to 04:03) to ensure high customer satisfaction and lower churn.
Product, Contract & Regional Breakdown: Visualized multi-dimensional trends across Subscription Plans (BE, CNI, FC, GK), Contract Types, Regional distribution (Radar Chart), and 5 Marketing Campaigns.
Technical Highlights:
Engineered a complex backend using 23 Pivot Tables and advanced formulas for automated calculations.
Designed a modern Dark Mode UI/UX with custom radial bar charts, line/area trends, radar charts, and dynamic KPI cards for executive-level storytelling.
Integrated interactive Monthly and Account Manager Slicers for instant drill-down analysis.

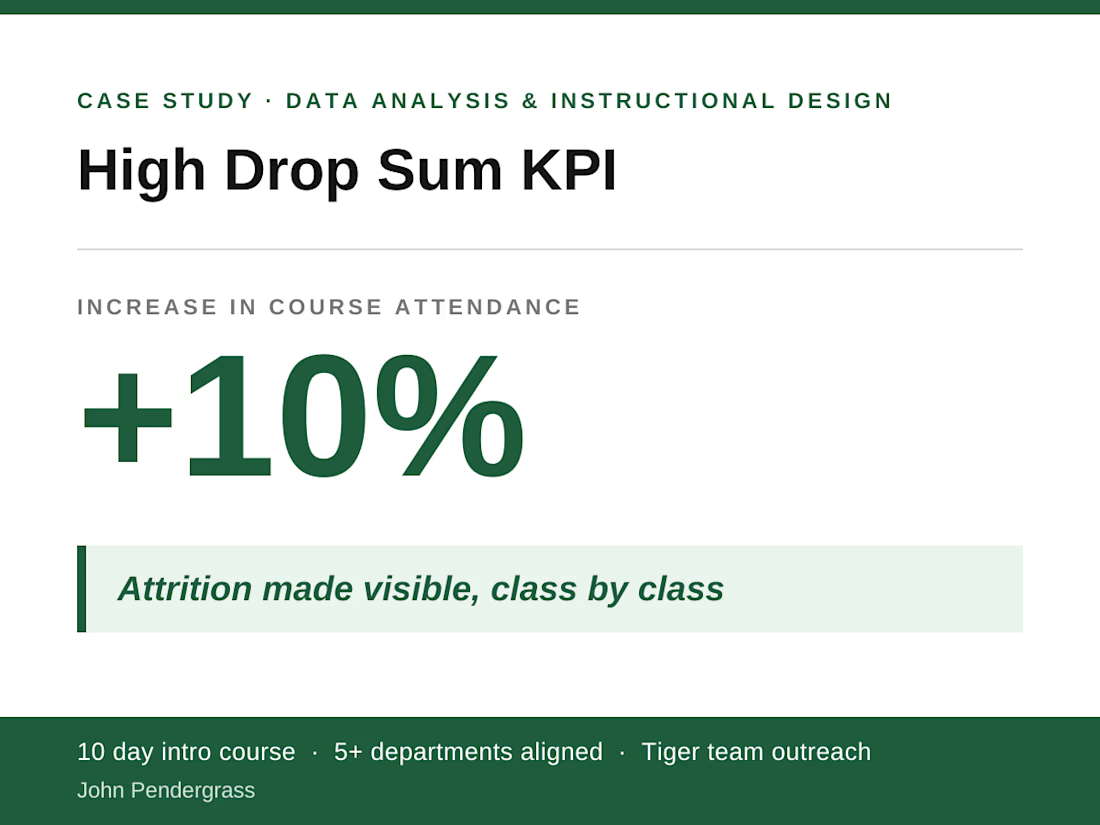
I co-designed High Drop Sum (HDS), a KPI that tracked attendance drops class by class in a free 10-day intro course, with yellow and red alerts that triggered tiger team outreach. I mapped every department’s touchpoints, cut early sales pressure, and led the data analysis. Course attendance rose 10%, with fewer cancelled cohorts.