The network for creativity
Join 1.25M professional creatives like you
Connect with clients, get discovered, and run your business 100% commission-free
Creatives on Contra have earned over $150M and we are just getting started
Back to feedPost
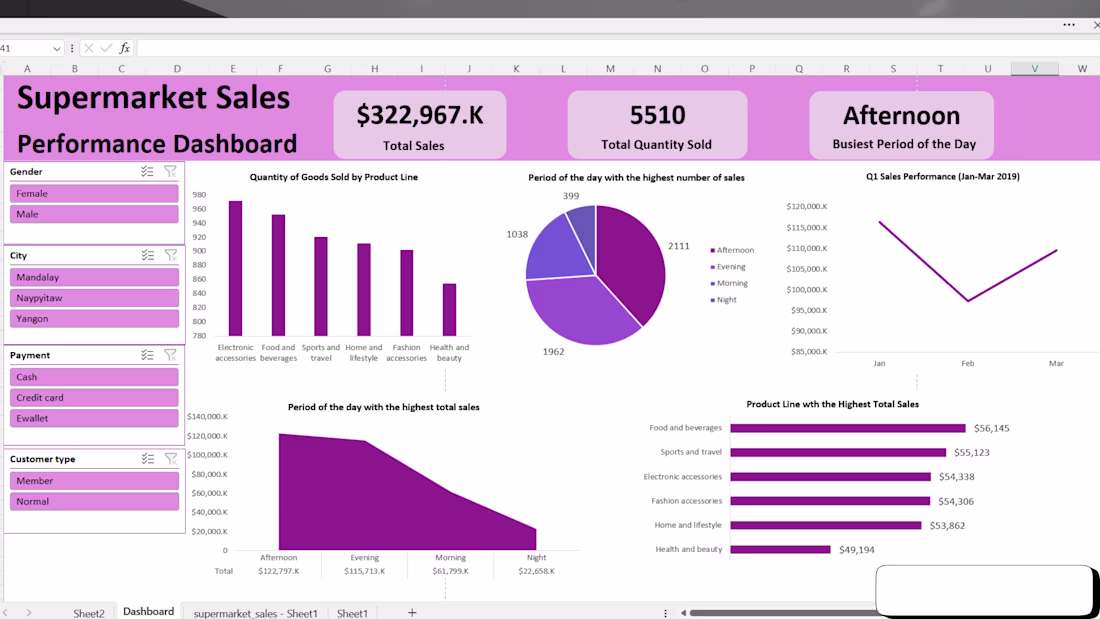
Sales Performance Dashboard (Excel)
I built this dashboard to help a business quickly understand how its sales are performing across products, locations, and time.
The goal was simple: turn scattered sales data into a single view that answers key questions: Which products drive revenue? Where are we growing? What needs attention?
Using clear visuals and KPIs, the dashboard highlights trends, top-performing product lines, and revenue contributions, making it easy for managers to spot opportunities and make informed decisions without digging through raw data.
This project demonstrates how data visualization can transform everyday sales data into actionable business insights.


Nice structure. When metrics are organized clearly, it becomes much easier for stakeholders to act on the data.

Thank you
The network for creativity
Join 1.25M professional creatives like you
Connect with clients, get discovered, and run your business 100% commission-free
Creatives on Contra have earned over $150M and we are just getting started


Trending


FLORA
Reusable workflows are replacing one-off prompts in creative AI. Share what you're building in FLORA.
portfolioreview
The best portfolios tell a story, not just show a grid. Share yours for feedback.
brandguidelines
Brand guidelines are becoming living systems. What are you building for your clients?
freelancerlife
Freelancer life is wins, pivots, and everything in between. What’s yours right now?
aivideo
AI video tools are moving at warp speed. Which ones are you experimenting with?