The network for creativity
Join 1.25M professional creatives like you
Connect with clients, get discovered, and run your business 100% commission-free
Creatives on Contra have earned over $150M and we are just getting started
Back to feedPost

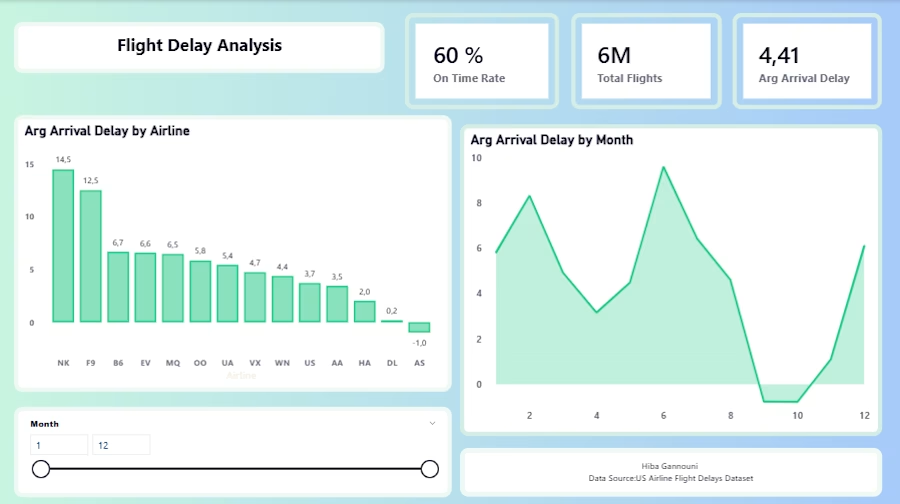
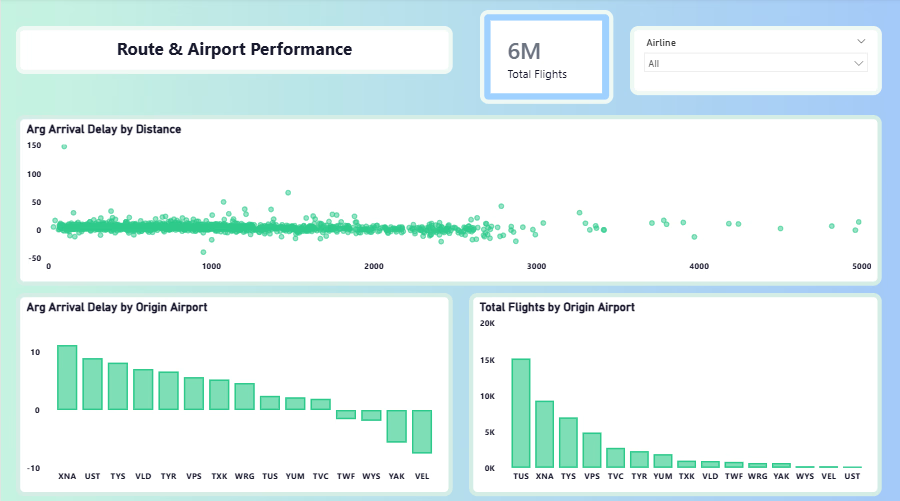
US Airline Flight Delay Analysis:
Operational performance analysis of US domestic flights covering 5.8 million records across 15 airlines and hundreds of origin airports.
Business Problem:
Which airlines and routes have the worst delay performance and what patterns emerge across months and distances?
Key Findings:
•On-time delivery rate sits at 61% across all carriers.
•Average arrival delay is 4.95 minutes across all flights.
•Significant delay spikes visible in summer months, particularly July and August
Dashboard Details.
•Covering airline delay performance and route and airport analysis.
•Interactive filters by month and airline.
•Sub-second load times across 5.8 million rows.
•Visuals include delay trends, scatter plot of distance vs delay, and airport performance breakdown.


The network for creativity
Join 1.25M professional creatives like you
Connect with clients, get discovered, and run your business 100% commission-free
Creatives on Contra have earned over $150M and we are just getting started

Challenges
View all


Related posts

What makes an A/B test readout useful to a product team?
My preferred first page answers four questions:
What changed, and by how much?
How uncertain is the estimate?
Did an important guardrail get worse?
What decision does the evidence support, and what remains unresolved?
A result can be statistically significant and still too small to matter. An inconclusive result can still leave a meaningful gain or loss plausible. The decision needs more than a green badge.
I built an independent A/B analyzer to make these checks easier to inspect. The project includes a live demo, downloadable reports and documented limitations:
https://contra.com/p/mgoXb3qY-ab-test-analyzer-correct-p-values-power-and-fdr
If you work on product or CRO, what do you wish analysts put on the first page more often?

This is a strong framing of experiment readouts: separating signal, uncertainty, guardrails, and the actual decision keeps the team honest. The reminder that significance is not the same as usefulness is especially important.

Shipment Status Breakdown