The network for creativity
Join 1.25M professional creatives like you
Connect with clients, get discovered, and run your business 100% commission-free
Creatives on Contra have earned over $150M and we are just getting started
Back to feedPost

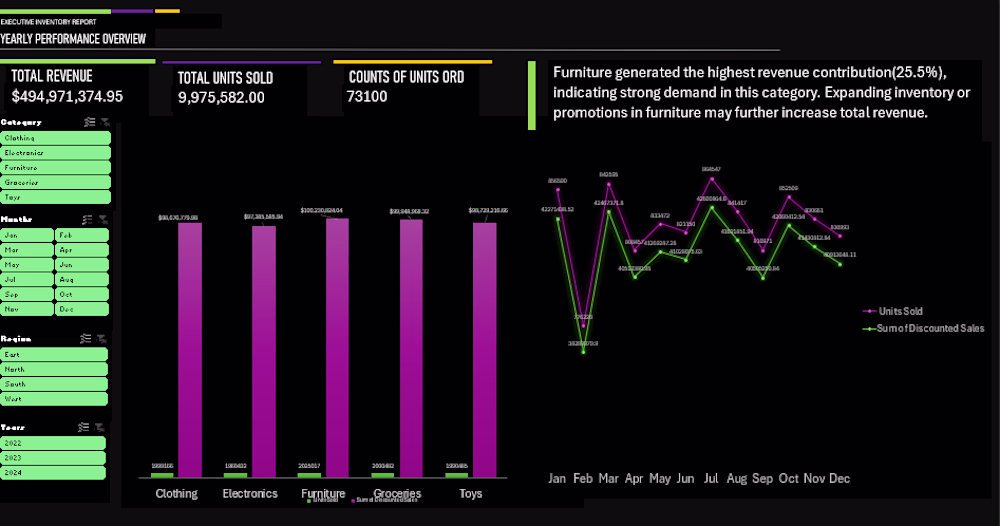
An interactive Excel dashboard analyzing 70,000+ rows of retail sales data across 5 categories, 4 regions and 3 years. Features KPI cards, dynamic slicers and business insight cards showing Furniture generated the highest revenue at 25.5%.


The network for creativity
Join 1.25M professional creatives like you
Connect with clients, get discovered, and run your business 100% commission-free
Creatives on Contra have earned over $150M and we are just getting started
Related posts


I’m speechless, this is great

AR Dashboard I created for Talespin


Amazing 🙌


Bro, this is actually fire. 🔥


Trending


Figma Make
Go from idea to prototype in minutes. What are you designing?
aivideo
AI video tools are moving at warp speed. Which ones are you experimenting with?
illustration
Handcrafted illustration is bubbling up across the web. What are you drawing lately?
aidesignflow
AI tools are redefining design work. What's your current workflow?
freelancerlife
Freelancer life is wins, pivots, and everything in between. What’s yours right now?