The network for creativity
Join 1.25M professional creatives like you
Connect with clients, get discovered, and run your business 100% commission-free
Creatives on Contra have earned over $150M and we are just getting started
Back to feedPost
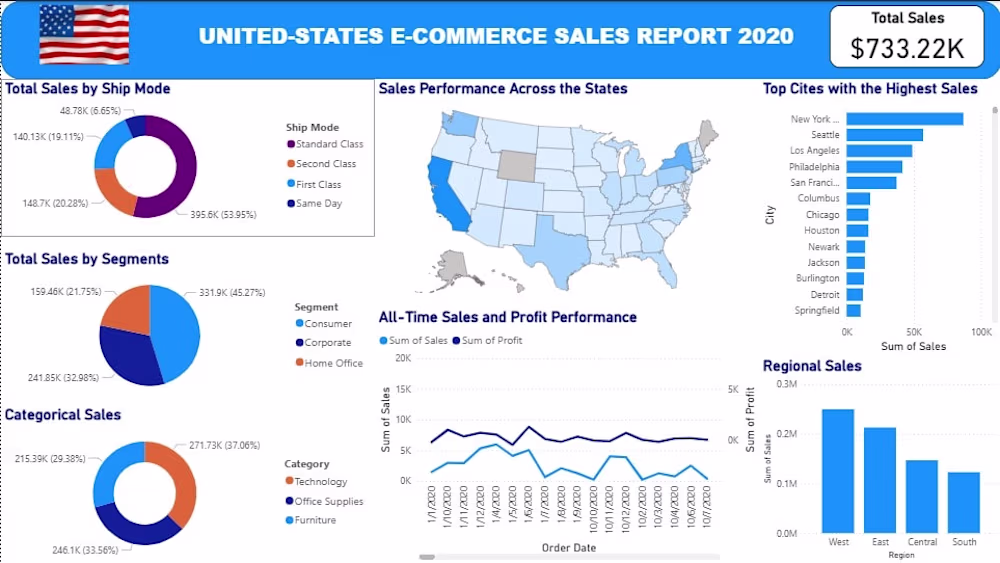
A comprehensive Power BI dashboard analyzing $733.22K in U.S. e-commerce sales for 2020. Uncovers top-performing cities, shipping modes, customer segments, product categories, and regional profitability trends through interactive maps, slicers, and time-series visuals.
Delivered a fully interactive Power BI sales performance dashboard for a U.S.-based e-commerce business using 2020 transactional data.
Tools Used: Power BI Desktop, Power Query for data cleaning & transformation, DAX measures for advanced calculations.
This dashboard empowered the client to quickly identify high-performing regions, optimize shipping strategies, and focus marketing efforts on the most profitable customer segments and product categories.
Perfect example of turning raw transactional data into clear, actionable business intelligence.
The network for creativity
Join 1.25M professional creatives like you
Connect with clients, get discovered, and run your business 100% commission-free
Creatives on Contra have earned over $150M and we are just getting started
Trending
Claude
Claude has entered the design space. How are you using it?
Contra University
Learn from expert creatives how to earn more using next-gen AI tools.
Brand Design
The best brand designers are on Contra. Scroll to see what's trending in brand design. What are you building?
creativeaiflow
Creative AI workflows are evolving. What tools do you use, and what are their strengths and weaknesses?
freelancerlife
Freelancer life is wins, pivots, and everything in between. What’s yours right now?