The network for creativity
Join 1.25M professional creatives like you
Connect with clients, get discovered, and run your business 100% commission-free
Creatives on Contra have earned over $150M and we are just getting started
Back to feedPost
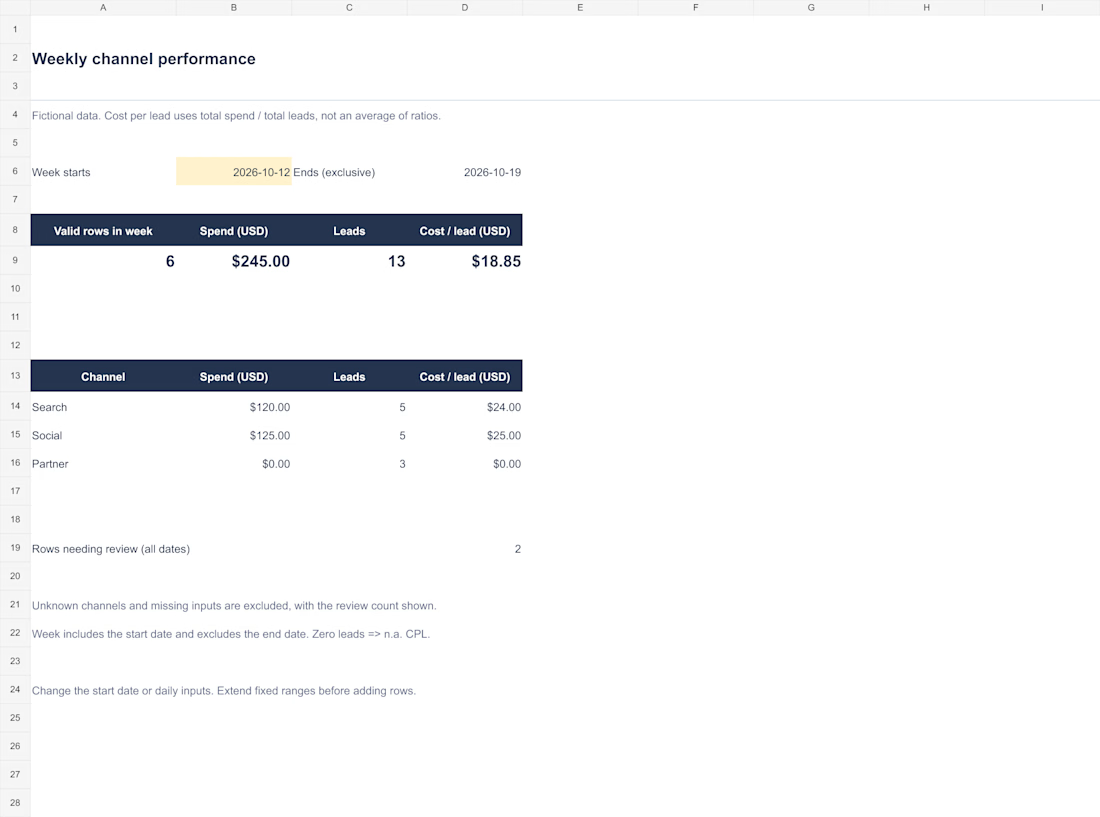
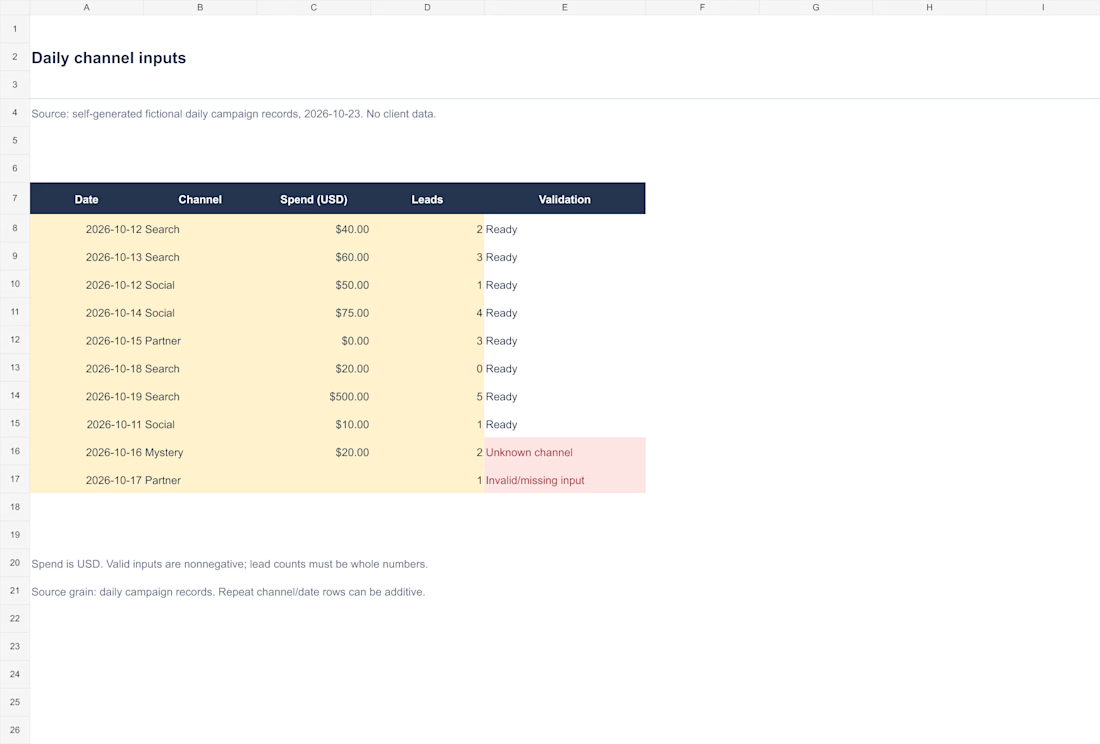
Weekly channel performance — self-initiated Excel demo with fictional campaign data.
For the week starting 12 October 2026, six valid records produce USD 245 spend, 13 leads and USD 18.85 cost per lead. Two source rows require review. These figures are sample data, not real campaign results.
The reporting date is editable. Cost per lead is calculated from matching totals. Week boundaries, zero leads, zero spend and missing values are handled explicitly.
Date changes, input changes and zero-versus-blank behavior were checked. AI-assisted implementation. Formula and visual checks passed; native Excel application testing was not performed.

The network for creativity
Join 1.25M professional creatives like you
Connect with clients, get discovered, and run your business 100% commission-free
Creatives on Contra have earned over $150M and we are just getting started



Related posts

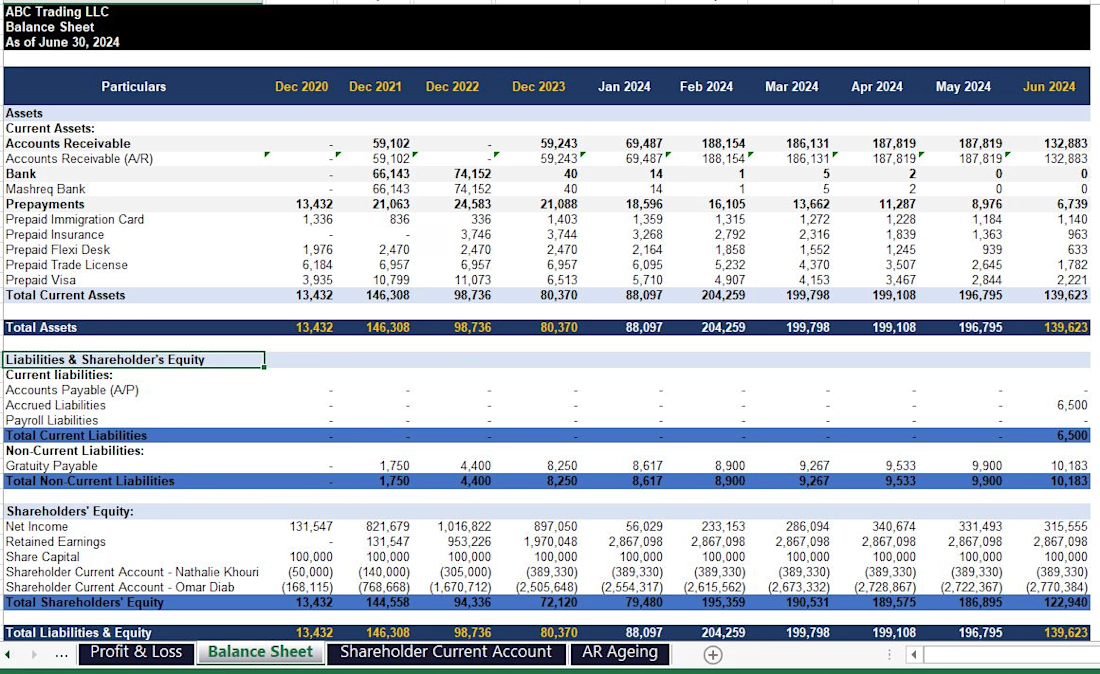
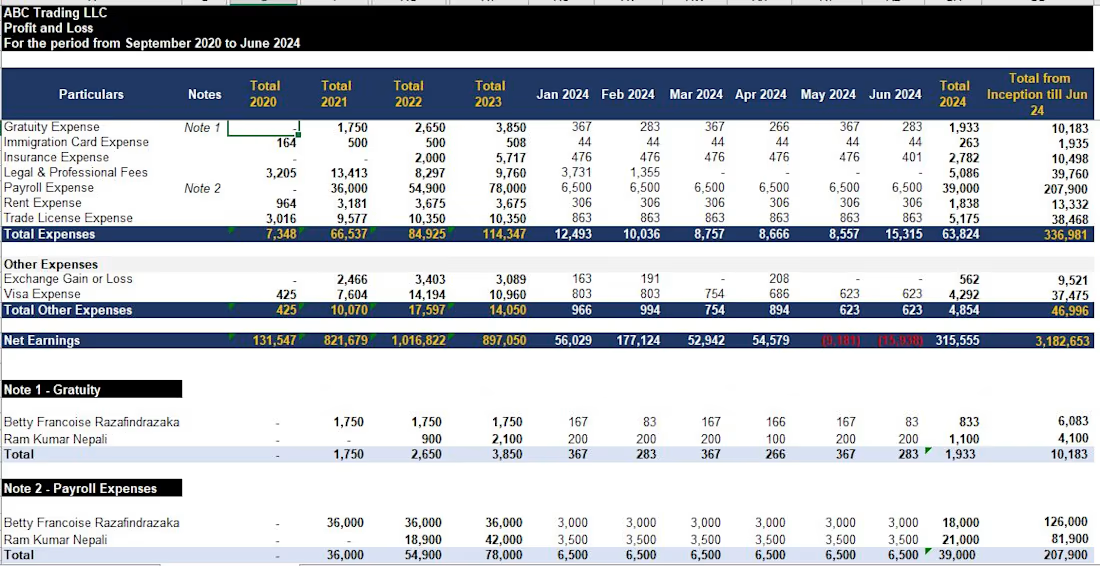
A client needed their books cleaned up from the company's inception and monthly financial reports for the current year.


we enjoyed and learned alot while doing this project .. more to come🙌
Developed a management accounts reporting process designed to help businesses understand their financial performance and make informed business decisions.
Good going fatimaa😍

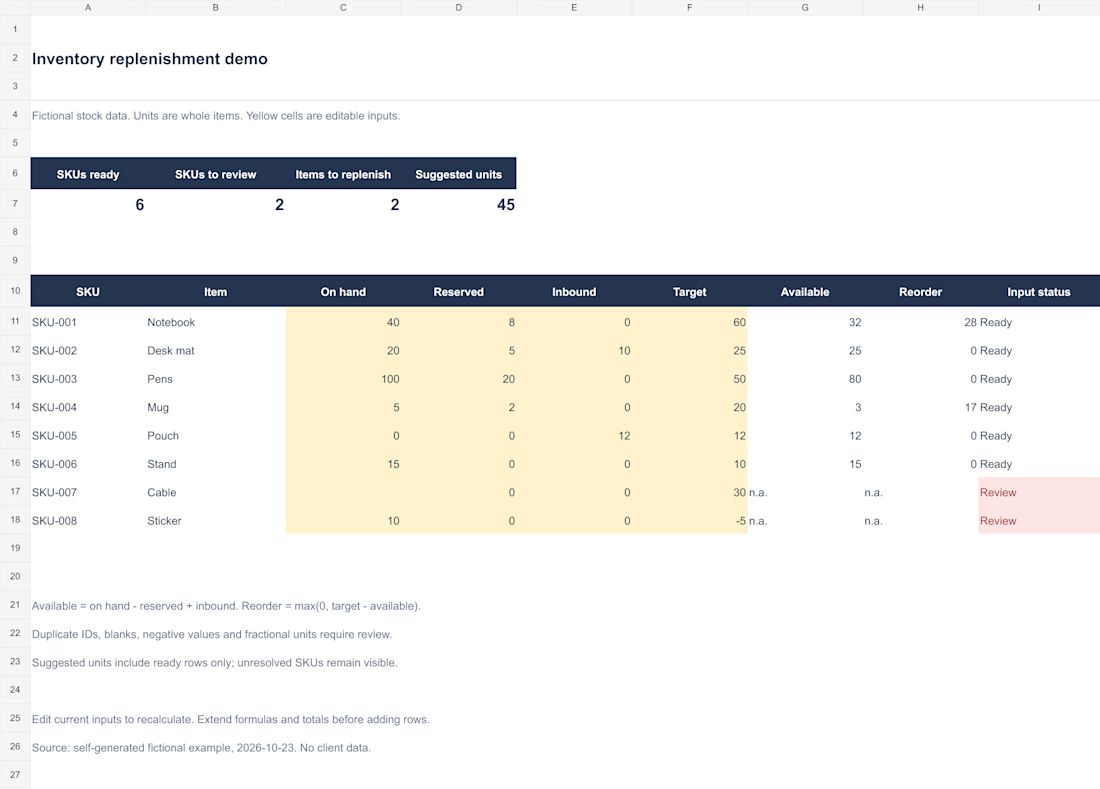
Inventory replenishment — self-initiated Excel demo with fictional data.
Eight SKUs: six ready and two flagged for review. The valid rows propose 45 units across two items. Available stock accounts for reservations and inbound quantities. Missing, negative, fractional and duplicate-key inputs remain visible for review.
Editable workbook with formula-driven reorder quantities. Checks covered input changes, zero versus blank, duplicate keys and restoration of the sample values.
AI-assisted implementation. This is a working demonstration, not client work. Formula and visual checks passed; native Excel application testing was not performed.