The network for creativity
Join 1.25M professional creatives like you
Connect with clients, get discovered, and run your business 100% commission-free
Creatives on Contra have earned over $150M and we are just getting started
Back to feedPost

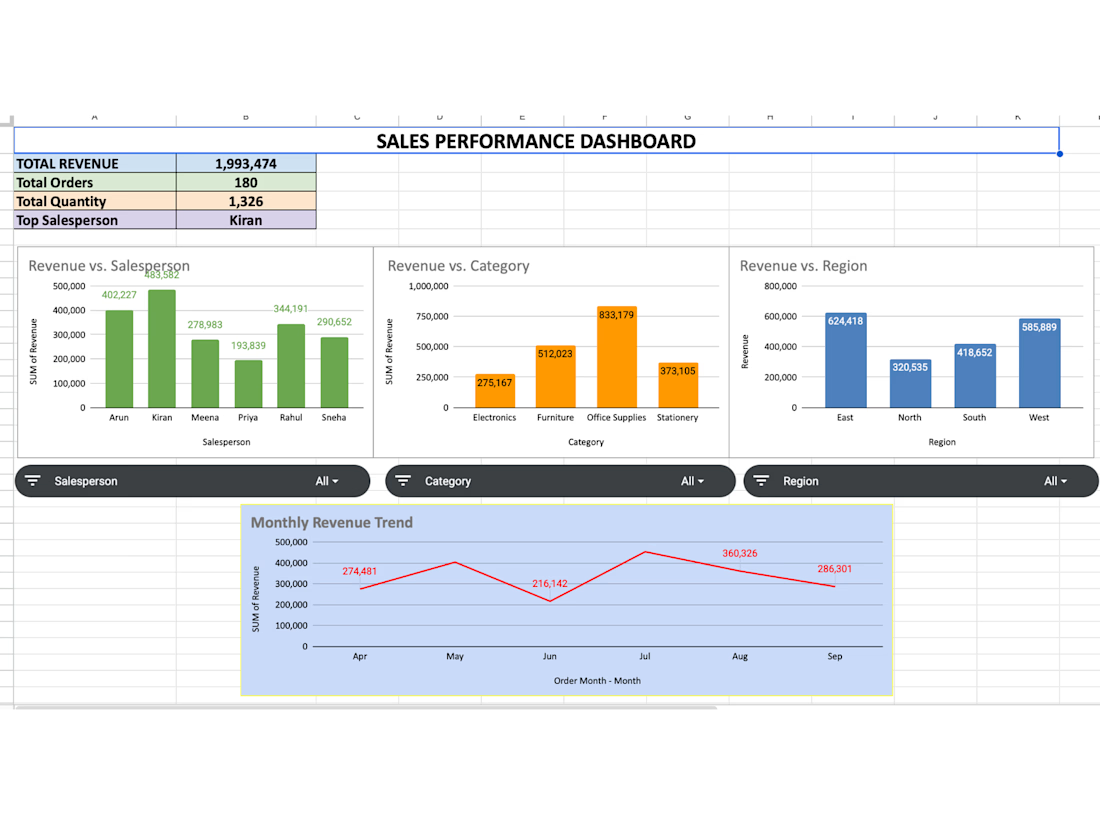
Built an interactive Sales Performance Dashboard in Google Sheets to analyze revenue, orders, quantity, salesperson performance, category performance, regional performance, and monthly revenue trends.
Key features:
• KPI summary
• Salesperson-wise revenue analysis
• Category-wise revenue analysis
• Region-wise revenue analysis
• Monthly revenue trend
• Interactive filters
Tools: Google Sheets, Pivot Tables, Charts, Data Analysis


The network for creativity
Join 1.25M professional creatives like you
Connect with clients, get discovered, and run your business 100% commission-free
Creatives on Contra have earned over $150M and we are just getting started
Challenges
View all


Related posts


Congrats on the first one! Landing on a workforce solutions angle for schools is a pretty specific niche. Was that the client's ask from the start, or did the positioning come out of your own research?


Interactive Sales Analysis Dashboard built in Microsoft Power BI to track sales, profit, profit margin, orders, and overall business performance. I used DAX measures for KPI calculations and Power Query for data cleaning and transformation. The dashboard includes dynamic filters for product, region, payment method, salesperson, store location, and date range for interactive analysis.