The network for creativity
Join 1.25M professional creatives like you
Connect with clients, get discovered, and run your business 100% commission-free
Creatives on Contra have earned over $150M and we are just getting started
Back to feedPost
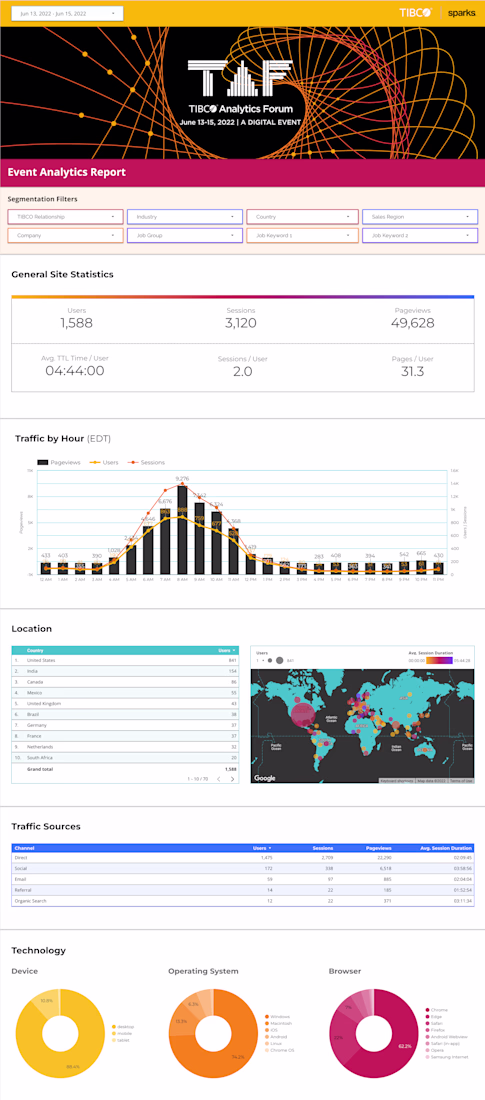
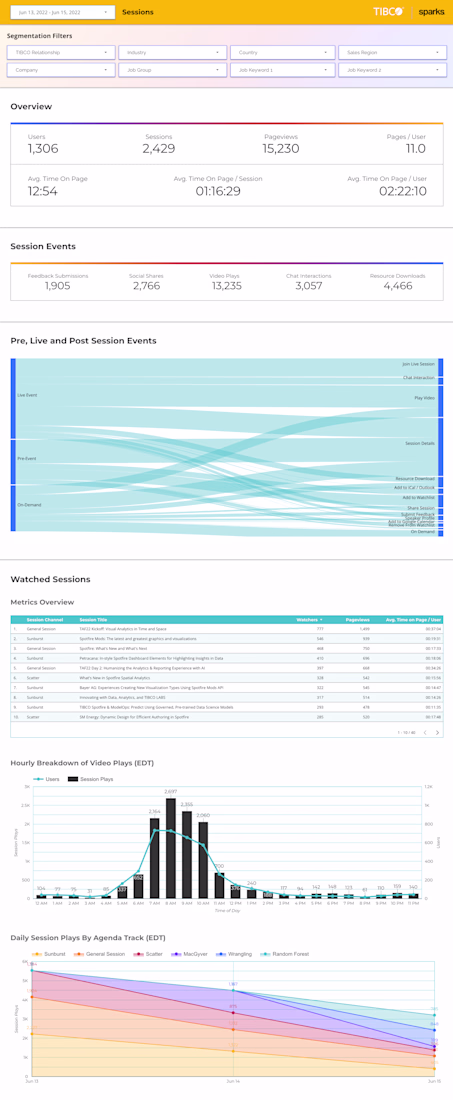
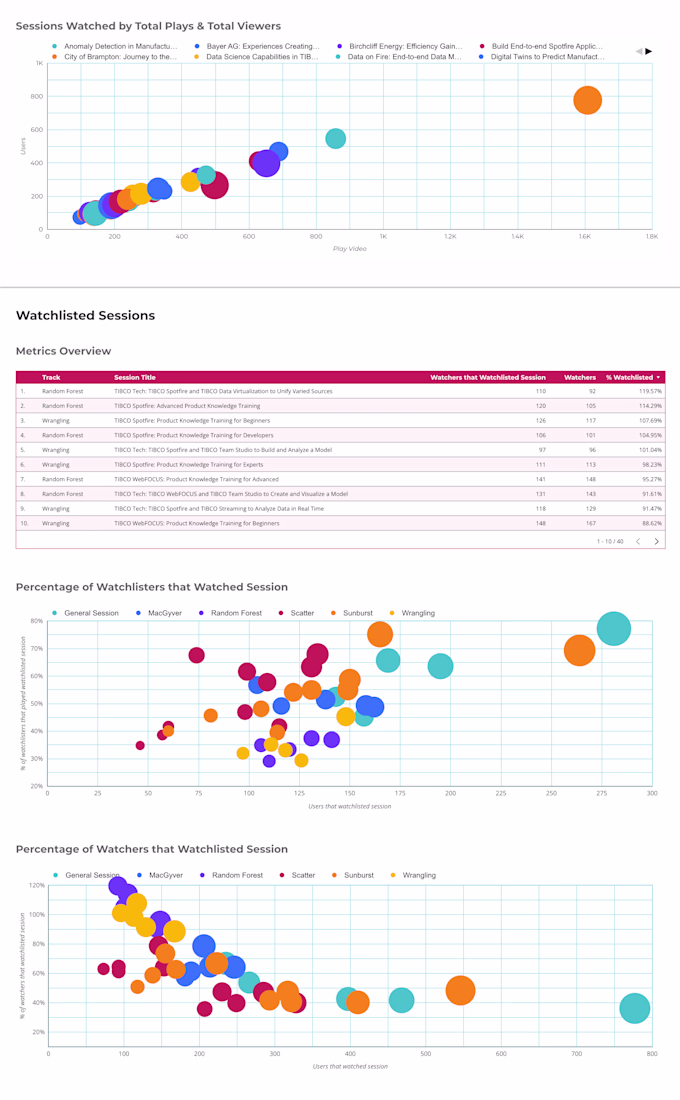
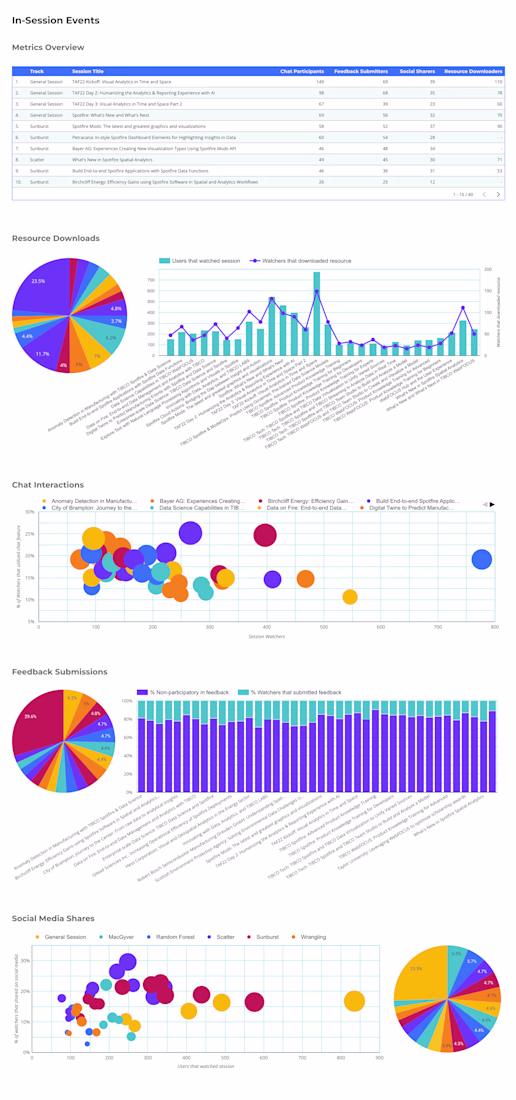
Hey Data Visualizers! Let's see your favorite data visualizations. Can we see your prettiest data? What are your tools of choice?
I'll start.
These are screenshots of a Looker Studio report I built for a client that hosted their annual conference virtually in 2021 - 2023. I collected and visualized metrics representative of conference attendee engagement throughout the event, and this was the end result for the 2023 event.
Generally speaking, I turn to Looker Studio for data viz, but I was a developer for 20 years before pivoting to data analysis and have rendered data in all manner of ways through code.
I'd love to see what the rest of you are up to, and learn how you do it. <3
The network for creativity
Join 1.25M professional creatives like you
Connect with clients, get discovered, and run your business 100% commission-free
Creatives on Contra have earned over $150M and we are just getting started
Trending
Claude
Claude has entered the design space. How are you using Claude Design?
Contra University
Learn from expert creatives how to earn more using next-gen AI tools.
creativeaiflow
Creative AI workflows are evolving. What tools do you use, and what are their strengths and weaknesses?
portfolioreview
The best portfolios tell a story, not just show a grid. Share yours for feedback.
freelancerlife
Freelancer life is wins, pivots, and everything in between. What’s yours right now?